

Trading Psychology: How to Review and Improve Your Trading Habits

Trading psychology is the study of how emotions, cognitive biases and behavioural patterns affect trading decisions. For active traders, the practical goal isn't to eliminate emotions. It is to identify how they change execution, measure those patterns in your trade data, and install rules that reduce their impact.
Most trading psychology advice starts with the same instructions: control your emotions, stay disciplined, be patient and follow your plan.
The problem is that none of those instructions tells you how to identify what is actually going wrong.
You cannot always recognise revenge trading while you are revenge trading. You may not notice that you are holding losing trades longer than winners. You may not realise that your fourth trade of the day is consistently worse than your first.
But your trade history can show you.
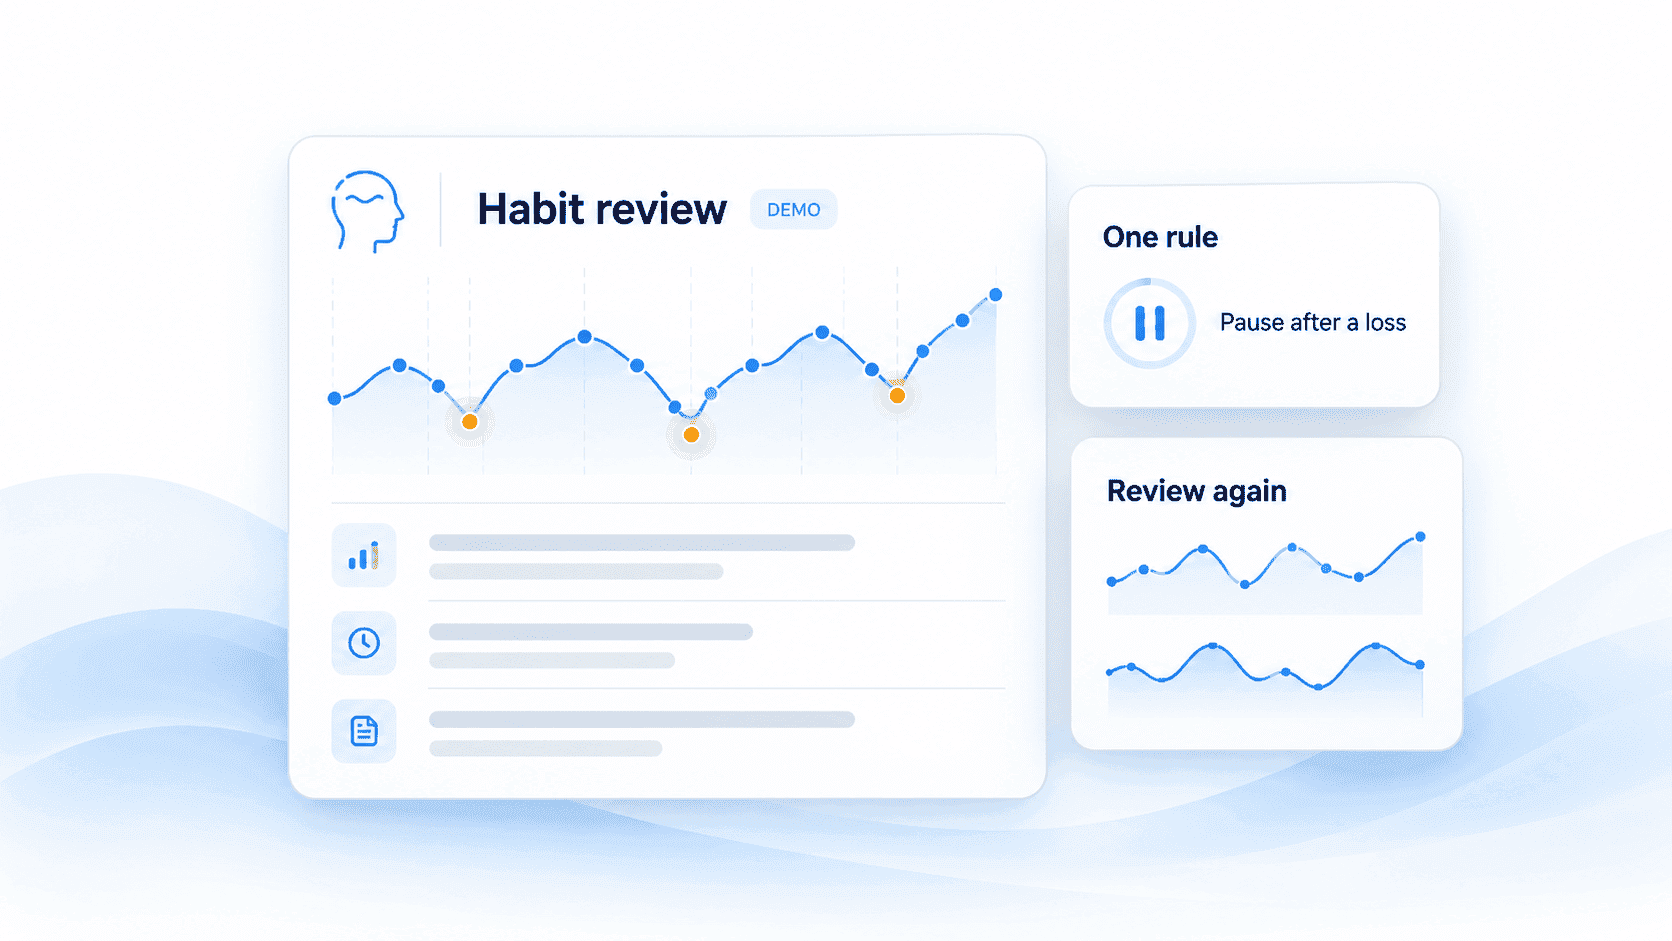
That is the idea behind the TraderWaves Five Tells framework: common trading-psychology problems can leave measurable signatures in your trading data. Once you identify a pattern worth investigating, you can try a predefined rule and review whether it helps you follow your plan.
Measure → identify → install a rule → re-measure.
The Five Tells of Trading Psychology
TraderWaves' Five Tells framework maps five common trading-psychology problems to the data patterns that can help you investigate them.
| Trading psychology problem | What it feels like | Metric to check | Possible data signature | Rule to consider |
|---|---|---|---|---|
| Revenge trading | “I can get that loss back.” | Post-loss expectancy vs. baseline | Trades after losses perform materially worse than your baseline | Cooling-off period |
| FOMO | “I can't miss this move.” | Untagged trades + MAE | Off-plan entries and greater adverse excursion | Pre-session watchlist |
| Loss aversion | “It will come back.” | Average hold time | Losing trades are held longer than winners | Time-based exit |
| Overtrading | “There must be another setup.” | Expectancy by trade number | Later trades perform worse than earlier trades | Daily trade cap |
| Fear after drawdown | “I need to be careful.” | Actual risk at entry vs. planned risk | Risk falls below the predefined plan without a planned reason | Predefined risk model |
These are review prompts, not a validated psychological test or universal thresholds. Compare each pattern with your own baseline, market, strategy and sample size. Use your notes and the surrounding circumstances to investigate possible causes; trade metrics alone do not establish your motivation.
Illustrative examples: all numerical examples in this article are hypothetical. They are not TraderWaves customer data or research findings.
A trading-psychology problem becomes easier to fix when you can measure how it changes your behaviour.
Why “control your emotions” is not enough
“Control your emotions” sounds sensible.
But it puts the entire solution on your ability to make a better decision at exactly the moment your decision-making may already be compromised.
After a loss, revenge trading does not necessarily feel like revenge trading. It can feel like confidence in the next setup.
After missing a move, FOMO does not necessarily feel like FOMO. It can feel like an unusually strong opportunity.
After several losses, reducing your position size may feel like responsible risk management even if your trading plan says your risk should remain constant.
This is why trading psychology is more useful as a diagnostic problem than as a test of character.
Instead of asking:
“Why can't I control myself?”
Ask:
“What changes in my trading behaviour when I am under pressure?”
Your trading journal can help answer that question.
The Five Trading Psychology Problems, Explained
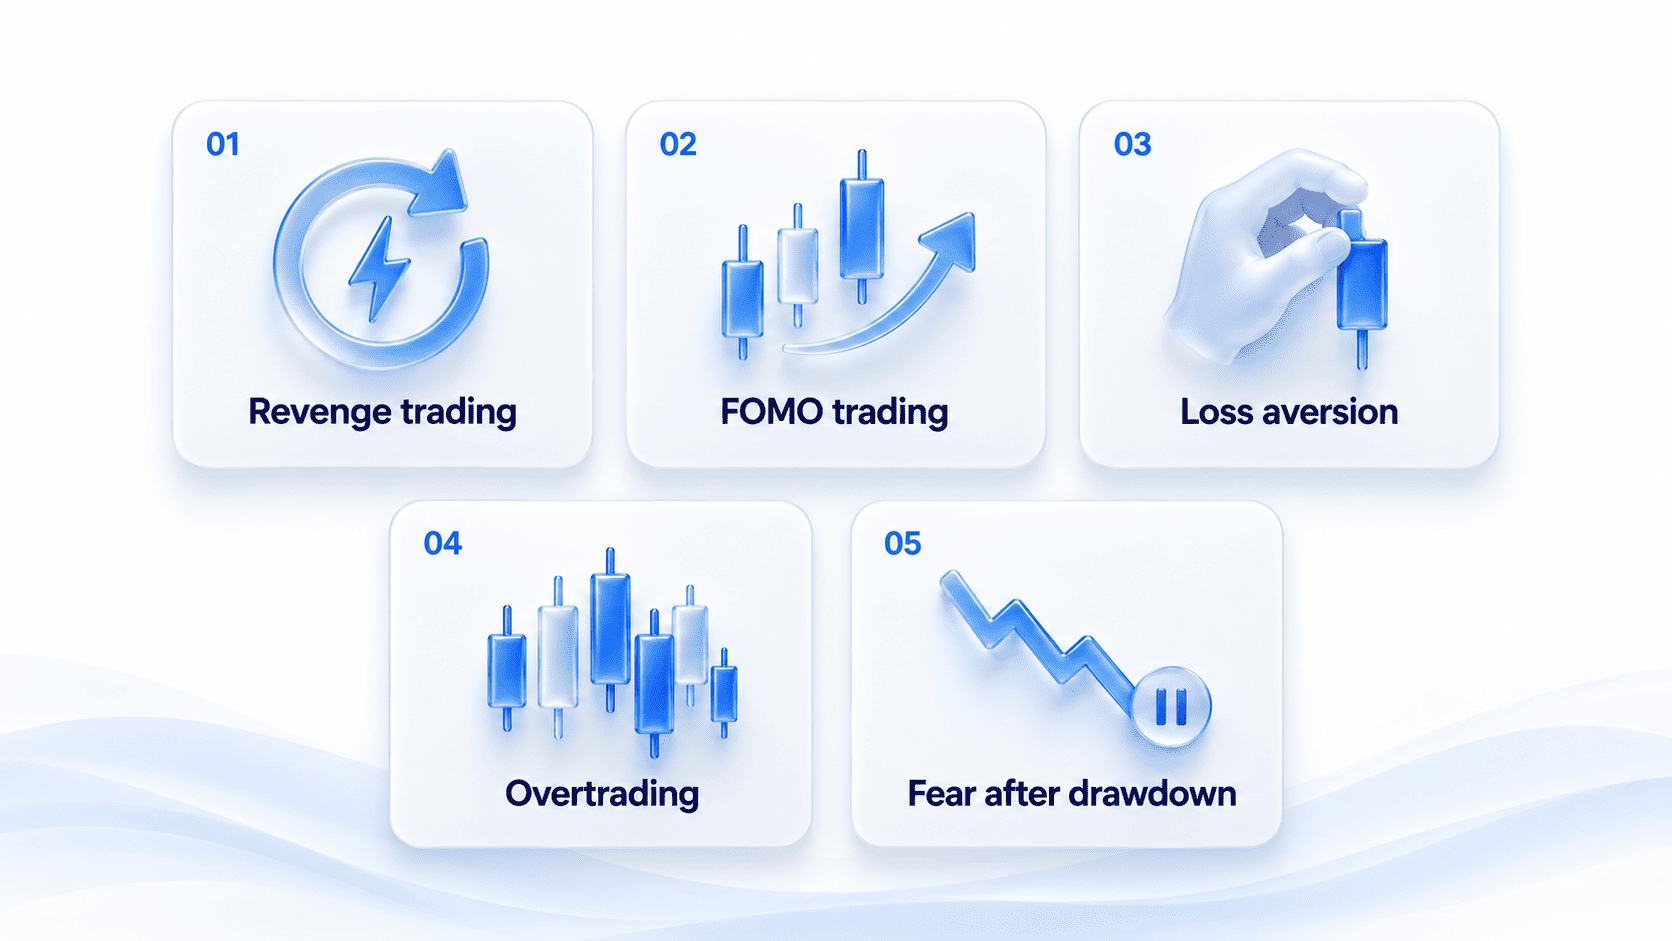
Each tell below is a place to look in your own history. The metric shows where behaviour changed. Your notes are what help you decide whether the cause is the one named here.
1. Revenge trading
Revenge trading happens when a trader takes a new position partly because they want to recover a previous loss. The defining feature isn't simply that the trade happens after a losing trade. A planned trade can legitimately occur after a loss.
The useful question is whether the quality or outcome of trades changes after losses.
How to measure revenge trading
Filter your trades that immediately followed a loss. Then compare their expectancy with your overall expectancy.
For example:
- Overall expectancy: +0.32R
- Trades immediately after a loss: −0.08R
That difference does not prove revenge trading by itself, but it gives you a measurable pattern worth investigating.
You can then examine whether other variables changed too:
- Position size
- Entry quality
- Setup tag
- Time between trades
- Stop placement
- Number of trades already taken that day
The rule that can help
Use a predefined cooling-off period after a loss or after a losing sequence.
The rule might be:
After a loss, wait 15 minutes before another entry.
The exact number should come from your own trading process rather than being treated as a universal rule. The objective is to remove an immediate decision from the period when you are most likely to act impulsively.
2. FOMO trading
FOMO—fear of missing out—often appears when a trader enters after a move has already started because they are afraid that waiting will mean missing the opportunity completely.
The problem is not simply entering late.
The problem is entering outside the conditions that originally define your strategy.
How to measure FOMO
Your setup tags can be useful here.
Review trades that:
- Have no setup tag
- Were tagged only after the trade was taken
- Were outside your predefined session
- Entered significantly later than your normal entry condition
- Show unusually high maximum adverse excursion (MAE)
An untagged trade does not automatically mean FOMO. It is a signal to investigate.
If a large percentage of your off-plan trades are losing trades or show poor execution metrics, you have a stronger case that impulsive entries are affecting your results.
The rule that can help
Create a pre-session watchlist. If the level or setup condition was not identified before the session, require yourself to document why the new trade qualifies before entering.
The goal is to turn:
“Should I take this?”
into:
“Does this meet my predefined conditions?”
3. Loss aversion
Loss aversion describes the tendency to react more strongly to losses than equivalent gains.
In trading, one practical manifestation can be holding losing positions longer while taking profits from winning positions too quickly. This pattern is known as the disposition effect in behavioural finance. Research by Terrance Odean documents investors’ preference for realising winners rather than losers. The pattern does not, by itself, establish why an individual trader behaved that way.
How to measure loss aversion
Start with one of the simplest comparisons in your journal:
Average hold time: winners vs. losers
If your losing trades are consistently held longer than your winning trades, investigate why.
Then compare the result with maximum favourable excursion (MFE).
MFE tells you how far a trade moved in your favour before it was closed. Compare that movement with your actual exit and the exit rules in your plan, using consistent units such as R. Final MFE is retrospective: a gap between MFE and realised profit does not, by itself, mean an exit was premature or that the maximum profit was realistically achievable.
The data does not tell you automatically that loss aversion is the cause. It tells you where to investigate.
The rule that can help
Consider a predefined exit rule:
- Time-based exit
- Fixed partial at a defined R
- Predefined profit target
- Mechanical invalidation level
The right rule depends on the strategy.
The purpose is to reduce discretionary decisions when the position is already open and emotions are strongest.
4. Overtrading
Overtrading is not simply “taking too many trades.”
A trader may take ten trades in a day because their strategy genuinely produces ten valid opportunities.
The more useful definition is:
Trading beyond the point where additional activity continues to produce acceptable results.
How to measure overtrading
Instead of looking only at the number of trades per day, examine expectancy by trade sequence.
For example:
| Trade number | Expectancy |
|---|---|
| Trade 1 | +0.40R |
| Trade 2 | +0.28R |
| Trade 3 | +0.05R |
| Trade 4 | −0.21R |
| Trade 5 | −0.36R |
This would suggest that something changes as the session progresses.
It could be fatigue, impatience, boredom, revenge trading, changing market conditions or simply the fact that the best setups have already occurred.
The data tells you when performance deteriorates. You then investigate why.
The rule that can help
If a sufficiently representative sample shows that later trades perform worse, investigate setup quality, time of day and market conditions before testing a daily trade cap. Reassess the cap using subsequent trades rather than assuming the original pattern will persist.
A trade cap should be a ceiling, not a daily target. If your limit is five trades, that does not mean you should find five trades. It means you stop looking for new trades once the limit is reached.
5. Fear after drawdown
Trading psychology is usually discussed in terms of excess:
- Too many trades
- Too much risk
- Too much confidence
- Too much activity
But the opposite can also affect execution.
After a losing streak, some traders reduce their position size below the risk level defined by their plan. Sometimes that is appropriate. If your strategy or account rules require lower risk during a drawdown, follow them.
The issue to investigate is whether risk changes because of an emotional reaction rather than the predefined risk model. A smaller position alone is not evidence of fear: lower equity, a wider stop or a different instrument can require a smaller position even when the planned risk percentage stays the same.
How to measure it
Compare the estimated loss at the initial stop, expressed as a percentage of account equity at entry, with the risk permitted by your plan. Account for stop distance and the instrument’s point, tick or unit value.
Look for:
- Risk percentage below plan without a planned reason
- Departures from the risk model after losses
- A return to planned risk only after a winning trade
- Increasing discretion around risk
Again, the pattern itself does not prove fear is the cause. It tells you that your execution has changed.
The rule that can help
Use a predefined position-sizing model.
For example:
Position size is calculated from account equity, stop distance, the instrument’s point or unit value, and the risk percentage permitted by the plan.
That makes position size an output of the process rather than an emotional decision.
How predefined rules can help
The five problems above have something in common.
The solution is not:
“Try harder to be disciplined.”
It is:
Remove the decision that repeatedly causes the problem.
If you revenge trade after losses, use a cooling period. If you chase moves, use a pre-session watchlist. If you hold losers too long, use a predefined exit. If later trades perform poorly, investigate the pattern and test a trade cap. If your risk departs from the plan after drawdowns, use a predefined position-sizing model.
This creates a simple loop:
Measure → Identify → Install a Rule → Re-measure
Then repeat.
Change one variable at a time where possible. If you simultaneously change your entry rules, risk model and trading hours, you will struggle to determine which change affected the outcome.
A 15-minute weekly trading psychology review
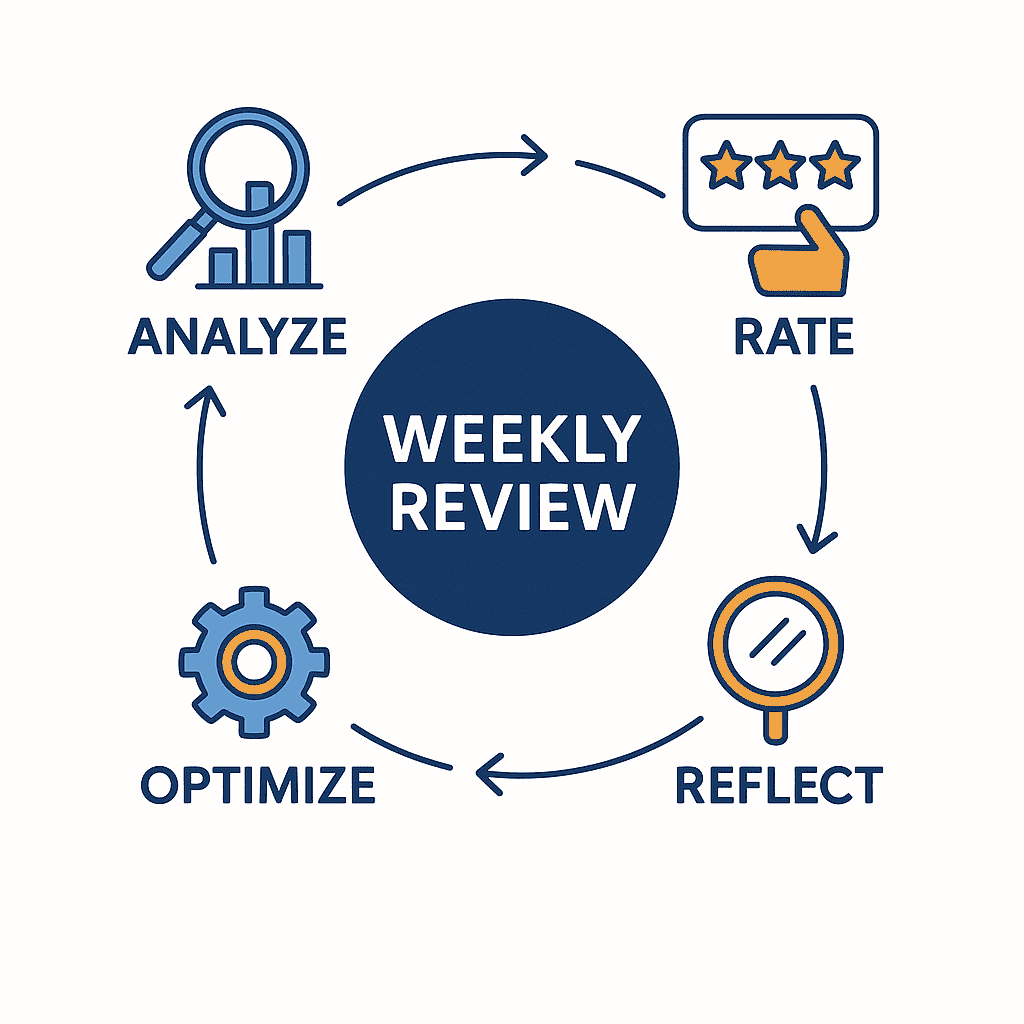
You do not need to spend hours journaling about how you felt during every trade. Fold these checks into how you review your trading week.
| Check | What to review | Red flag |
|---|---|---|
| Post-loss expectancy | Trades following a loss vs. baseline | Materially below baseline |
| Off-plan trades | Missing or inconsistent setup tags | Increasing over time |
| Hold time | Winners vs. losers | Losers held materially longer |
| Trade sequence | Expectancy by trade number | Later trades deteriorate |
| Risk at entry | Actual risk percentage vs. planned risk | Risk below plan after losses without a planned reason |
These checks are most useful when compared with your own baseline rather than an arbitrary universal threshold.
For example, “30% worse” may be meaningful for one trader and noisy for another depending on sample size and strategy.
The goal is not to find a magic number. The goal is to identify a repeatable behavioural pattern.
The trading psychology metrics worth tracking
A trading journal can record more than entry, exit and profit/loss. For psychology analysis, several additional fields can be particularly useful.
Expectancy
Expectancy estimates the average outcome of your trades over a sample, which is why it helps you look beyond win rate.
It can help you compare:
- Trades after losses vs. normal trades
- Early trades vs. later trades
- Tagged vs. untagged trades
- Different sessions
- Different strategies
MAE — Maximum Adverse Excursion
MAE measures how far a trade moved against you before closing.
It can help identify whether late or emotional entries experience unusually poor price movement after entry.
MFE — Maximum Favourable Excursion
MFE measures how far a trade moved in your favour before closing.
It can help you review exits against your plan when compared in consistent units. It does not show that the best possible exit could have been identified in real time.
Average hold time
Comparing winners and losers can reveal behavioural differences that are difficult to notice while trading.
Position size
Compare estimated risk at the initial stop, as a percentage of equity at entry, with planned risk. Raw position size alone is not a reliable comparison across different equity levels, stop distances or instruments.
How to test whether your trading psychology is improving
Do not rely only on whether you “feel more disciplined.” Use the same measurements that identified the problem.
Suppose you discover that:
Trades immediately following losses have negative expectancy.
You install a 15-minute cooling-off rule. Then measure the same metric again over a defined sample of subsequent trades. Check whether you follow the rule and whether the behaviour changes. Also review outcomes after trading costs and your risk exposure. A before-and-after difference can reflect changing market conditions or setups as well as the rule itself.
The same approach works for the other tells:
Loss aversion
Before:
Losing trades held 42 minutes on average.
After:
Losing trades held 24 minutes.
Overtrading
Before:
Trades 4–6 produced negative expectancy.
After:
A three-trade daily cap prevents those trades.
Fear after drawdown
Before:
Average risk fell to 0.4% after losing streaks despite a 1% plan.
After:
Risk at entry follows the predefined model, with position size adjusted for equity, stop distance and the instrument’s value.
These examples illustrate changes in behaviour, not proof of improved profitability. Shorter holding times and fewer trades are not automatically better. Use the metrics alongside your notes, plan adherence, risk exposure and outcomes after costs to assess whether the change is useful.
The books worth reading on trading psychology
Three books are particularly useful for different reasons:
Trading in the Zone — Mark Douglas
Useful for understanding probabilistic thinking, uncertainty and why traders often seek certainty where none exists.
Thinking, Fast and Slow — Daniel Kahneman
Not a trading book, but a useful background for understanding cognitive biases and decision-making under uncertainty.
The Daily Trading Coach — Brett Steenbarger
More practical and exercise-based than many trading psychology books, making it useful for turning psychological ideas into routines.
The important step is what happens after reading. Take one idea and test it against your own trading behaviour. Reading another book is not a substitute for measuring what is actually happening in your account.
Your trading psychology verification step
You can start with two checks.
1. Compare average hold time
Compare average hold time for winning and losing trades. If losing trades are held materially longer, investigate whether your exit process is allowing losses to run while profits are being taken too quickly.
2. Compare post-loss expectancy
Filter trades taken immediately after a loss. Compare their expectancy with your overall baseline.
If the difference is consistently negative, investigate whether the trades are changing in:
- Setup quality
- Position size
- Entry timing
- Risk
- Trade frequency
Then choose the most relevant rule and re-measure after a defined sample. You do not need to fix every psychological problem simultaneously.
Find the biggest measurable problem. Fix that one first.
Conclusion
Stop diagnosing yourself by feel.
You may not recognise your own tilt while you are in it. Your trade history gives you another perspective.
A single losing trade cannot tell you that you have a psychology problem. Neither can a single impulsive entry.
But repeated behaviour across a sufficiently large sample can give you something much more useful: a pattern you can measure.
That changes the question from:
“Why can't I control my emotions?”
to:
“What does my trading data show me about how I behave under pressure?”
Once you can answer that, the next step is much clearer.
Measure it. Install a rule. Re-measure it.
Start free with TraderWaves for unlimited journal notes and screenshots, automatic trade imports from supported platforms, and tools to review your trades. Pro adds Journal Charts with MAE and MFE. Use the available metrics alongside your notes to investigate patterns in your trading.
What is trading psychology?
Trading psychology is the study of how emotions, cognitive biases and behavioural patterns affect trading decisions. For active traders, it is useful to focus on how those patterns change execution and how they can be identified through trading data.
Why is trading psychology important?
Trading psychology matters because a profitable strategy can still be executed inconsistently. Emotional decisions can affect entry timing, position size, trade frequency, stop placement and profit-taking. Measuring those behaviours can make them easier to identify and correct.
How do I improve my trading psychology?
Start by identifying one repeatable behavioural problem in your trade data and create a rule that addresses it. For example, use a cooling-off period after losses, a daily trade cap for overtrading, or a predefined exit rule for loss aversion. Then re-measure the same behaviour.
What is emotional trading?
Emotional trading occurs when emotions or psychological reactions influence decisions outside the trader's predefined process. Common examples include chasing a missed move, increasing risk after a loss, holding a losing position too long or taking trades that do not meet the strategy's conditions.
What is revenge trading?
Revenge trading is taking a trade partly to recover a previous loss rather than because the trade independently meets your strategy's conditions. One way to investigate it is to compare the expectancy of trades taken after losses with your overall baseline.
How do I stop revenge trading?
Use a predefined cooling-off rule rather than relying on willpower. After a loss or losing sequence, wait a set amount of time before taking another trade. The exact period should fit your strategy and be defined before you are under pressure.
How do I stop overtrading?
Review whether additional trades are associated with weaker results, then investigate possible causes before testing a daily trade ceiling. Compare expectancy by trade number alongside setup, time of day and market conditions. A cap is a ceiling, not a target, and should be reassessed against subsequent results.
How do I stop FOMO trading?
Define your setups and key levels before the trading session and require a trade to meet those conditions before entering. Tracking setup tags can help identify trades that were taken outside your normal process.
What is loss aversion in trading?
Loss aversion is the tendency for losses to have a stronger psychological effect than equivalent gains. In trading, it can contribute to behaviours such as holding losing positions too long or taking profits too quickly.
Can a trading journal improve trading psychology?
A trading journal can help by making behavioural patterns visible in aggregate. It cannot eliminate emotions, but it can help you identify changes in expectancy, hold time, position size, trade frequency and rule-following that may occur under pressure.
How long does it take to improve trading psychology?
There is no universal timeframe. Installing a behavioural rule can happen immediately, but determining whether the rule changed your behaviour requires a defined sample of subsequent trades. The appropriate sample depends on the behaviour, strategy and frequency of your trading.
Ready to journal?
Start Tracking Your Trades Today
Sign up now and access advanced trade journaling tools for free.
Start Free: No Credit Card