How Much Should You Risk Per Trade?
There is no single percentage that every trader should risk on every trade.
Rules such as “risk 1%” or “never risk more than 2%” can be useful starting points, but they are not universal answers. CME Group describes the popular 2% rule as an arbitrary threshold and notes that traders may choose tighter or looser limits depending on their own risk approach.
This guide walks through three decisions in order. Your risk percentage defines how much of the account you are prepared to lose. Risk/reward evaluates the opportunity. Position size turns that planned risk into a trade size.
Step 1
How much am I prepared to risk?
Not sure how much to risk? Start with Step 1
Step 2
Is this trade worth that risk?
Already know that you are prepared to risk? 0.5%? 1%? $100? Skip to Step 2
Step 3
What position size lets me take the trade while staying inside that risk?
Already know your risk and stop? Ready to size the trade? Go to Step 3
Step 1: How Much Are You Prepared to Risk?
Ask yourself one question before you enter: how much of the account are you prepared to lose if this trade does not work?
Your risk percentage tells you how much of your account you are prepared to lose if the trade reaches your stop.
Planned risk
Planned risk = account equity × chosen risk percentage
Example: on a £10,000 account, risking 1% means you are prepared to lose around £100 on the trade. That figure is an estimate if the position exits at the intended stop. Slippage, gaps, spreads, commissions, fees or execution delays can make the actual loss larger.
The maths is easy. The harder part is deciding whether 0.5%, 1%, 2% or another figure actually fits your strategy, account and the way you trade when things go wrong.
The same percentage can feel very different depending on your account size, how often you trade, how many positions you hold at once, whether those positions are related, any external account restrictions, and whether you can keep following your process after several losses. CME’s trade-plan guidance recommends defining not only how much you will risk on one trade, but also how many positions you are willing to run and the maximum overall account exposure you will accept.
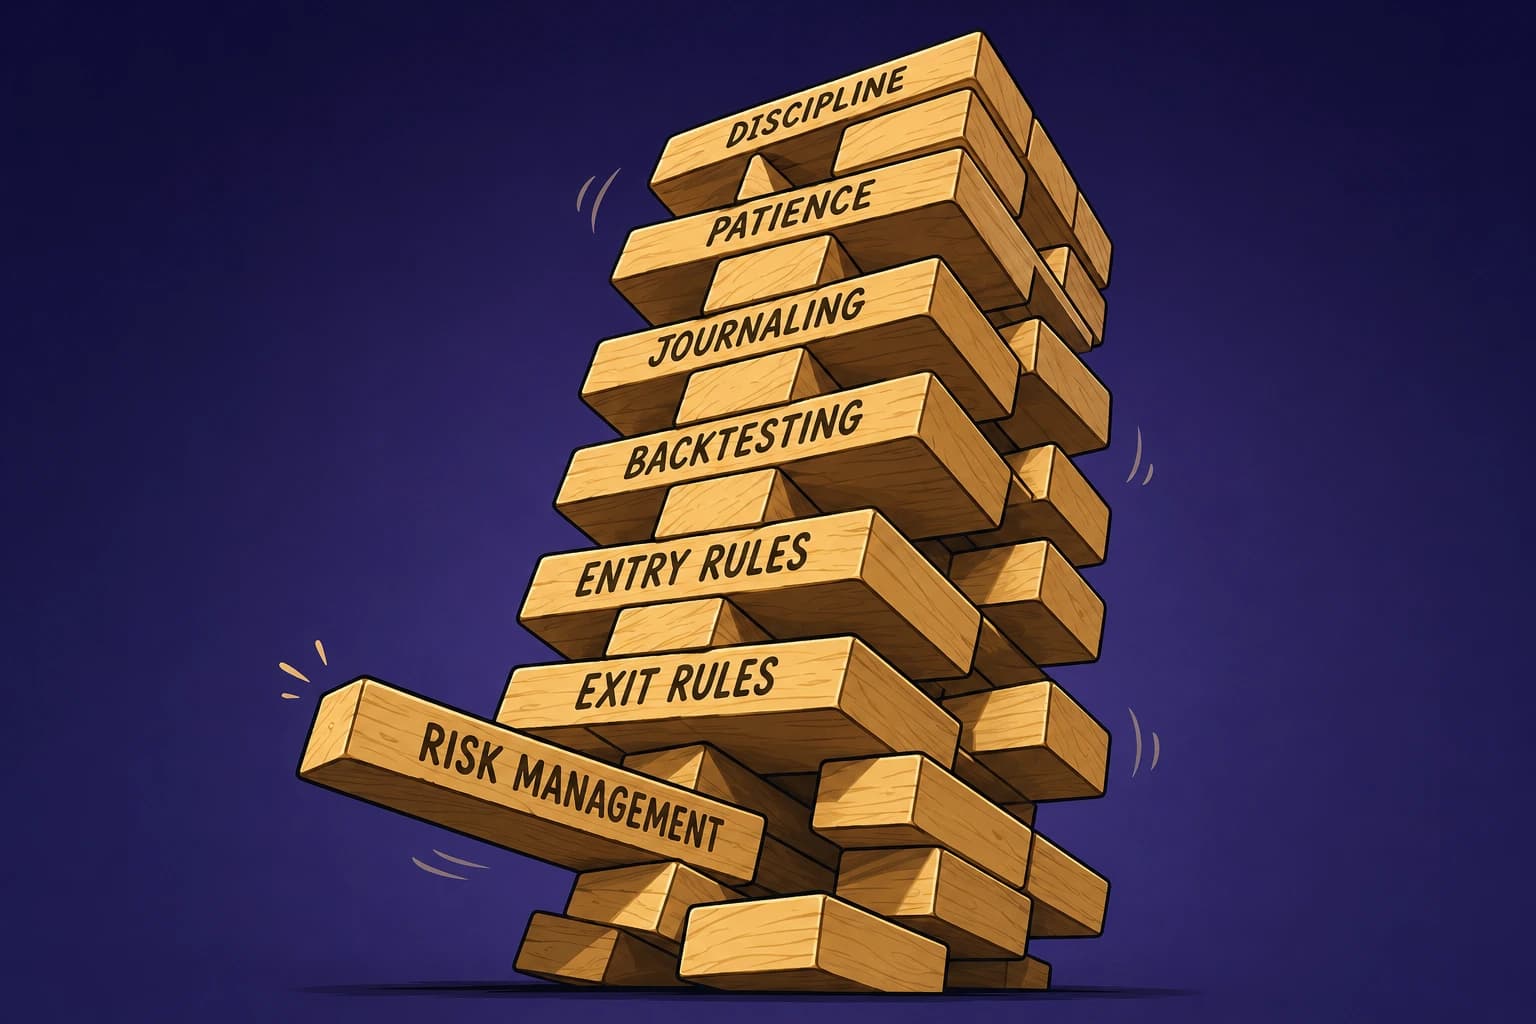
As The Fastest Way to Blow Up a Good Trading Strategy shows, a setup can be sound and still become unmanageable if too much capital is attached to each loss.
Key takeaway: Calculating 1% or 2% is easy. Deciding whether that amount fits your strategy is the difficult part.
What Would a Losing Streak Do to Your Account?
One trade rarely creates the biggest problem. Ask what a normal bad run would do to your account.
Example
Imagine a £10,000 account and five losing trades in a row.
At 1% risk per trade, recalculated from current equity each time, the account would fall to roughly £9,510 — a drawdown of about 4.9%.
At 2% risk per trade, the same five losses would leave roughly £9,039 — a drawdown of about 9.6%.
The strategy and losing streak are the same. The only thing that changed was how much was risked on each trade.
Would you still feel comfortable taking the sixth valid setup after a 5% drawdown? What about after nearly 10%? A percentage that looks small on one trade can feel very different across a normal losing streak.
Key takeaway: Choose a risk level you can still follow during a normal bad run for your strategy.
Look at How Your Strategy Actually Behaves
Before settling on a risk percentage, look at how your strategy has actually behaved over time. A high win rate can feel reassuring, but it tells you very little on its own if your losing trades are much larger than your winners.
Win rate is the percentage of trades that finish profitably. Average win versus average loss shows the size of typical winners compared with typical losers. An 81% win-rate strategy may look safe until the average loss is several times the average win. As Why Your Win Rate Can Lie shows, headline results need the risk story behind them.
Expectancy and profit factor
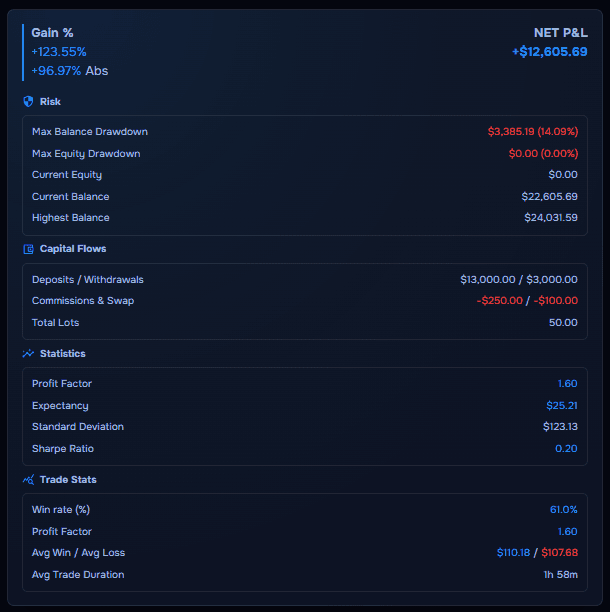
Expectancy gives you a rough idea of how much the strategy has historically made or lost per trade on average: (win probability × average win) − (loss probability × average loss).
Profit factor compares the strategy’s total gross profits with its total gross losses (gross profit ÷ gross loss). Together, these measures help you see the balance between winners and losers.
Drawdown and losing streaks show how difficult periods affect equity. A strategy can win often and still carry more risk than the headline win rate suggests if its losing trades are much larger than its winners. Use these measures together to ask: does this risk percentage make sense for the way my strategy actually performs?
Key takeaway: Look at the size of wins and losses, expectancy, profit factor and drawdown together before raising your risk.
Don’t Look at One Trade in Isolation
Your risk percentage might look sensible on one trade, but what happens when you have three or four positions open at the same time?
Your risk per trade can look sensible on its own, but several similar positions can add up quickly. If those trades are exposed to the same currency, sector or market move, they may also lose at the same time.
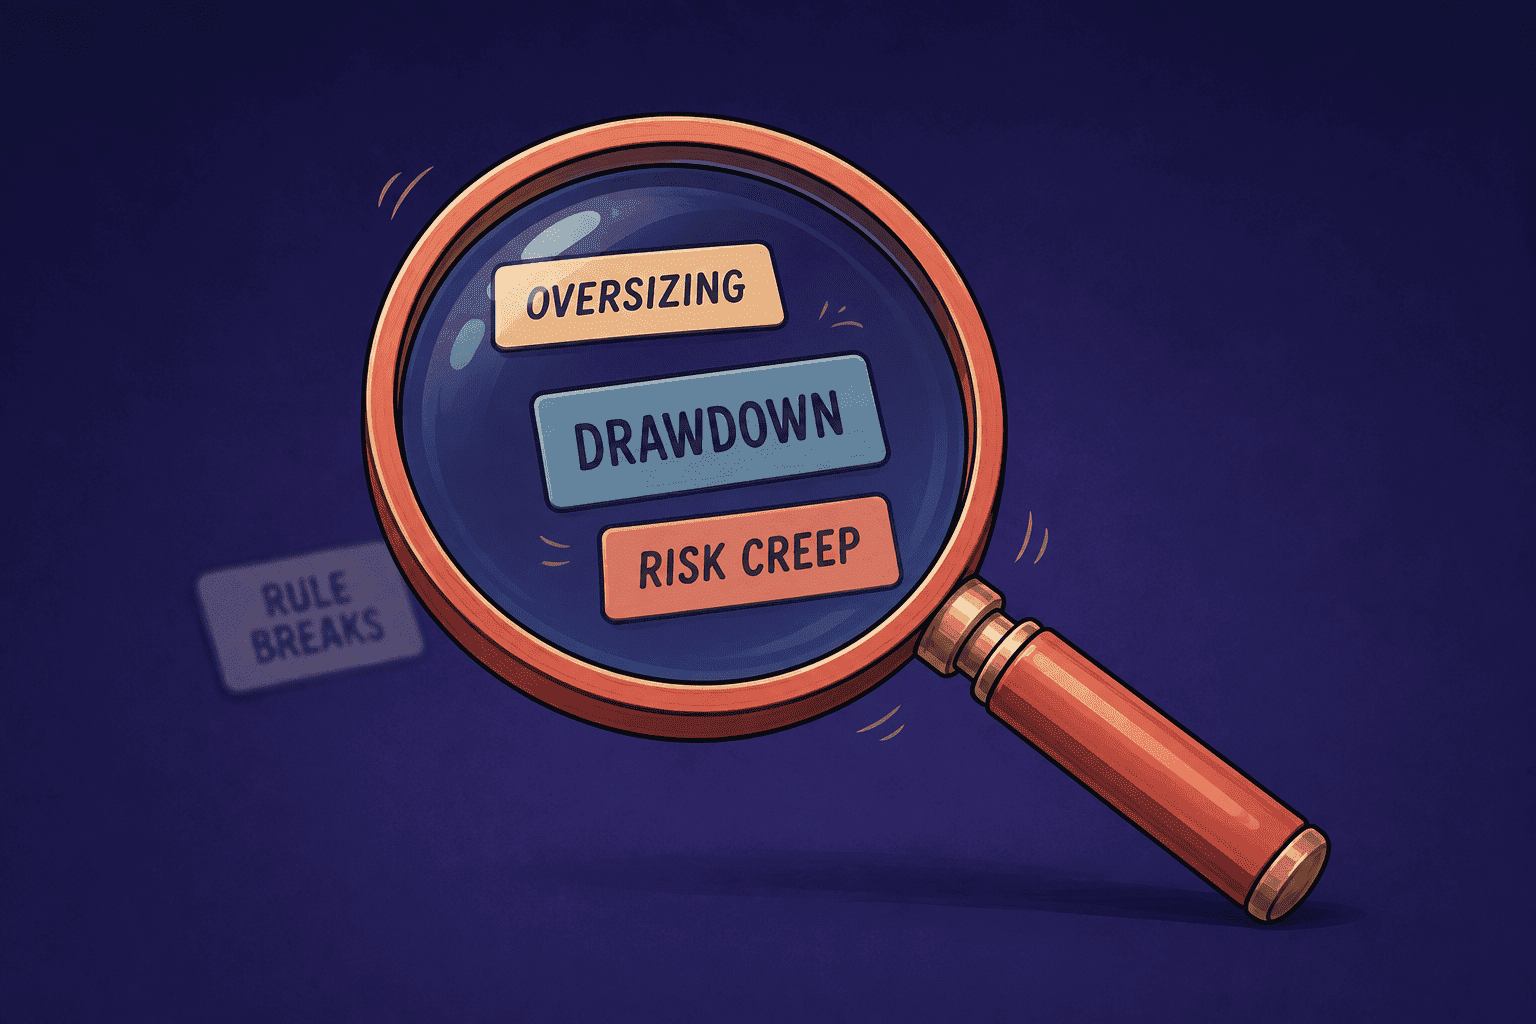
Four trades each risking 1% do not mean the account is only taking 1% risk overall. If several fail together, the combined loss can be much larger. How to Spot Risk Problems Before They Become Expensive treats that combined exposure as a separate check from single-trade sizing.
External account rules can tighten the same decision. A risk level that feels comfortable personally may still breach a prop account’s daily loss or drawdown limit when several trades are open. Look at individual-trade risk, total open exposure, drawdown and the specific account rules together. Prop constraints will be covered in more depth later in this series.
Key takeaway: Your risk per trade can look conservative while your total account exposure is not. Check what could happen if several open positions move against you together.
Step 2: Is the Trade Worth the Risk?
If you already know how much you are prepared to risk — say £100 — the next question is whether the potential reward is worth the downside of this setup.
Look at your entry, stop and target. A Risk/Reward Calculator helps you compare the potential upside and downside before you commit capital.
Example
Entry: 1.2000 · Stop: 1.1950 · Target: 1.2100
Risk distance = 50 pips. Potential reward = 100 pips. Risk/reward = 1:2.
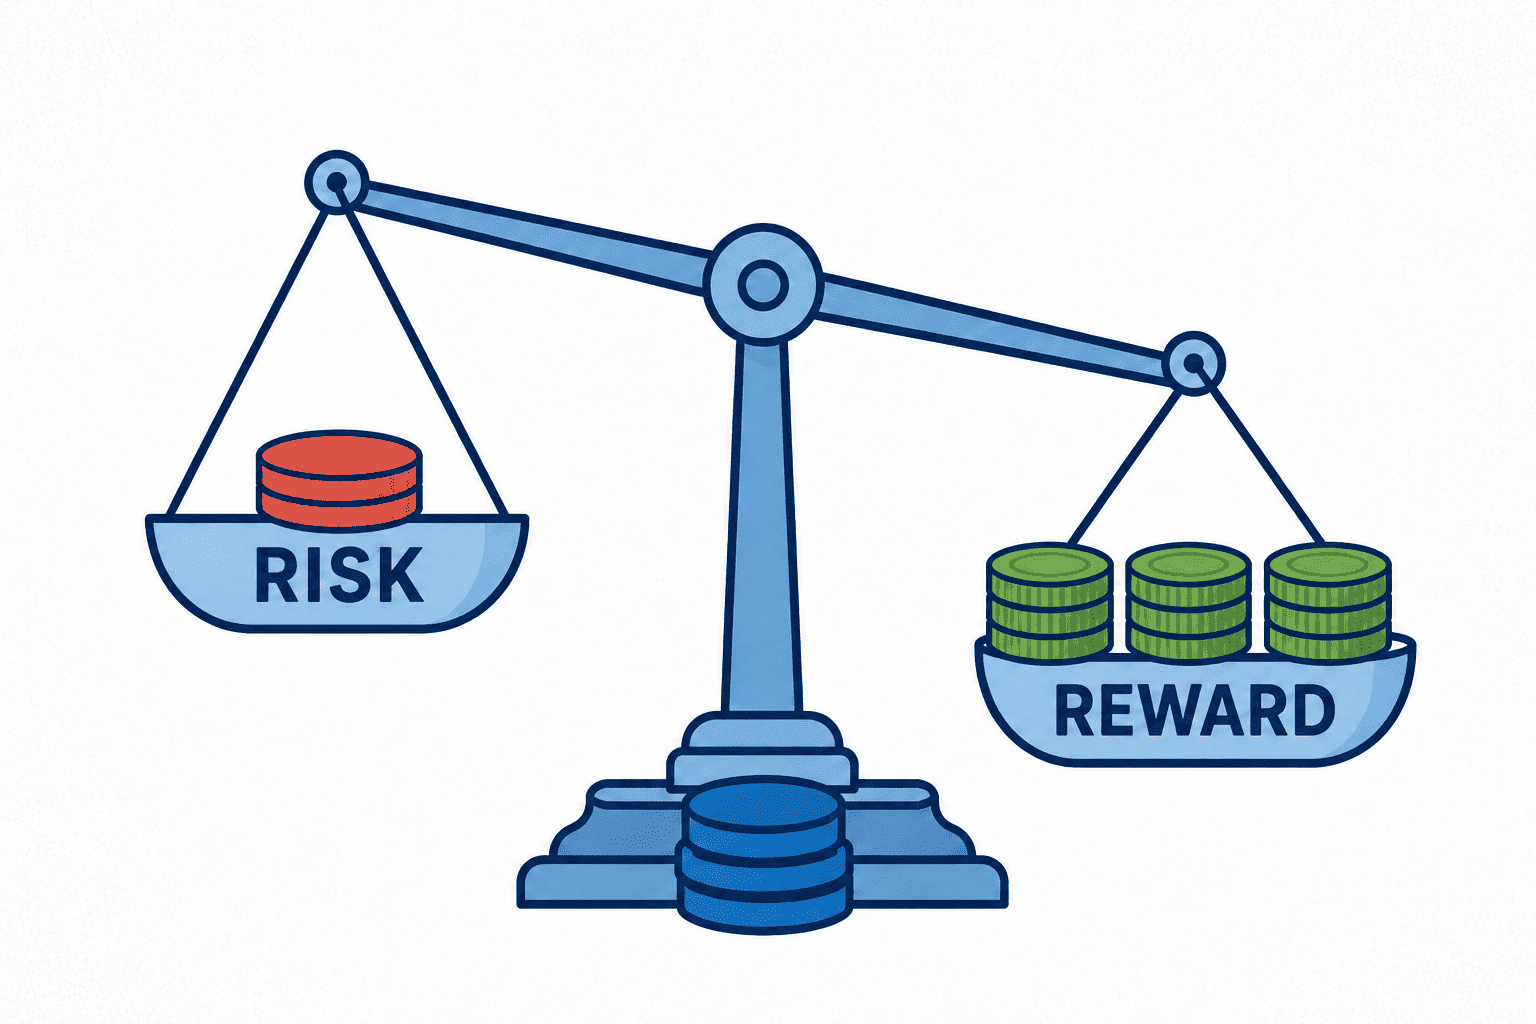
For every 1 unit of downside, the setup offers 2 units of potential upside.
Risk/reward does not choose how much money to put at risk. A 1:2 trade could involve £20 of account risk or £2,000. It only describes the relationship between your stop and target, not how large the position should be.
A higher ratio is also not automatically better. A 1:4 setup that rarely reaches its target may have worse expectancy than a 1:1.5 strategy that wins more consistently. Risk/reward describes one setup’s payoff structure. Expectancy reflects how the strategy has performed across many trades when probability is also considered.
Key takeaway: Use risk/reward to judge whether the opportunity looks worthwhile — alongside how your strategy has actually performed, not instead of your planned risk amount.
Step 3: What Position Size Fits the Risk?
If you already know your risk amount and where your stop needs to be, you can work out how large you can make the trade while staying within the amount you are prepared to risk.
On a £10,000 account, risking 1% means you are prepared to lose around £100 on the trade. If the setup requires a 25-pip stop, a Position Size Calculator works out the lot size or volume that keeps a stop-out near that £100.
Position sizing formula
Position size = planned risk ÷ risk per unit
Risk per unit depends on stop distance, pip, point, tick or share value, the instrument, account currency, and spread, fees or commissions where relevant.
In forex, volume is commonly expressed in lots: 1.00 lot = 100,000 units, 0.10 lot = 10,000 units, 0.01 lot = 1,000 units. A large lot size does not automatically mean high risk. Risk depends on position size, stop distance, instrument value and account size together. The same £100 of planned risk can mean a larger lot with a tight logical stop, or a smaller lot with a wider stop.
Let the stop come from the setup, then adjust size around it. Do not choose a large lot first and squeeze the stop closer merely to fit the monetary loss. CME’s educational material advises placing stops at logical levels rather than random points chosen to fit a trade.
Example
You are prepared to risk £100. Your setup needs a stop 20 points away. At a larger size, that stop would cost £200. You can halve the position and keep the 20-point stop, or keep the larger size and move the stop to 10 points. The second option brings the loss back to £100 but changes the trade. If the setup needs 20 points of room, adjust size, not the invalidation level.
Work in this order: logical stop, planned risk amount, then appropriate position size. Broker margin tells you what you can open, not what fits your risk plan.
Key takeaway: Keep the logical stop and size the trade so that reaching it approximately matches the amount you are prepared to lose.
Check Whether Your Trading Matches the Plan
Risk management is not finished when the trade is placed. Does your live trading match the risk you planned?
Compare planned risk with realised losses when stopped, position size, stop distance, consecutive losses, combined exposure when several positions were open, and whether size changed after wins or losses. Findings such as doubling size after a losing day, larger realised losses on certain instruments, or clustered related trades matter more than copying another trader’s percentage.
A trade journal and trade analytics make that comparison easier over time.
Key takeaway: Check that what you actually do still matches the risk limit you chose.
Conclusion
There is no universal percentage that tells every trader exactly how much to risk per trade.
Decide what downside your account and strategy can tolerate, evaluate whether the setup offers enough potential reward, then size the position so that reaching the logical stop stays within the planned risk.
TraderWaves helps you run that process with the Risk/Reward and Position Size calculators, then review whether planned risk, size and streaks stayed consistent in analytics and your journal.
How should I use the 1% or 2% risk rule?
What is the difference between risk percentage, risk/reward and position size?
What can the TraderWaves calculators help me work out?
Should I adjust my stop or my position size?
How should I use risk/reward when deciding whether a trade is worth taking?
How does per-trade risk relate to total account exposure?
Which strategy metrics are useful when choosing a risk percentage?
How can I check whether I am actually sticking to my risk plan?
Ready to journal?
Start Tracking Your Trades Today
Sign up now and access advanced trade journaling tools for free.
Start Free: No Credit Card