

Liquidity Sweep in Trading: What It Is,
How to Spot It, and How to Verify It

In SMC trading, a liquidity sweep usually describes price briefly pushing beyond a recognised high or low, where stop orders may be clustered, before returning inside. Traders often interpret this as stops being triggered, but the chart alone cannot confirm who traded or why price reversed.

The problem with sweeps
You watch the price grind sideways under a clear resistance level for two hours. Equal highs, obvious to anyone with a chart. Then one candle rips through, takes out the highs, and you get long on the breakout. Ninety seconds later the price is back below the level and your stop is gone.
What you just experienced fits the pattern traders often call a liquidity sweep. The level was visible in advance. The outcome was not. That distinction matters, because recognising a level where stops might sit is different from knowing whether price will reverse after crossing it.
Naming the pattern is the easy part. Trading it consistently means defining what qualifies, when you enter and where the idea is invalidated. The gap between a convincing annotation and a usable trading rule is where accounts get damaged.
This article covers what a sweep describes, a three-condition framework for defining one, clues to assess after a level breaks, and then the part that matters to your account: how to check whether your sweep trades are actually making you money.
What a liquidity sweep is
Market liquidity is the ability to buy or sell without causing a large price change. In an order book, resting limit orders provide liquidity that incoming orders can trade against.
Stop orders work differently. They are conditional orders that become active when their trigger conditions are met. On CME Globex, for example, stop orders do not immediately enter the executable order book. What happens after activation depends on the order type. A stop-limit order can remain unfilled if the market moves beyond its limit. 1
In SMC discussions, traders often use "liquidity" more loosely to mean areas where they expect stops to be concentrated. A trader who is long may place a sell stop below support. A trader who is short may place a buy stop above resistance. Breakout entry orders can also sit beyond those levels.
There is evidence that stop orders cluster around certain prices. Research using orders from a large foreign-exchange dealing bank found clustering around round numbers, with differences between buy stops, sell stops and take-profit orders. That supports the idea that order placement is not random. It does not establish a stop cluster beyond every visible high or low. 2
A sweep, as used in this article, is the chart pattern that forms when price breaks a recognised level and then returns inside. One interpretation is that triggered stops supplied orders for participants taking the other side. Above a high, buy stops can meet selling interest; below a low, sell stops can meet buying interest.
The pattern does not prove deliberate targeting, institutional involvement or a completed large order. Triggered stops can also accelerate a breakout. New York Fed research documents stop-loss orders contributing to rapid, self-reinforcing currency moves rather than automatically causing reversals. 3
Three terms get used in overlapping ways:
- Liquidity sweep often describes price moving through a watched level and, in reversal setups, returning inside.
- Stop hunt implies deliberate targeting of stop orders, an explanation that a candle chart alone cannot establish.
- Liquidity grab is sometimes used for a quicker or shallower version, though usage varies between traders and educators.
This article uses "sweep" for the reversal pattern and defines the exact setup below.
Where traders look for potential liquidity pools
The following levels are common reference points for sweep setups. They are candidates to investigate, rather than a ranking of proven reliability or a map of confirmed orders.
| Level type | Why traders watch it | How to mark it |
|---|---|---|
| Equal highs / equal lows | Repeated turning points can become reference levels for stops and breakout entries | Mark the matching wick extremes and define how close they must be to count as equal |
| Previous day high / low (PDH / PDL) | Prior daily extremes are widely watched reference points | Extend the previous day's extremes, using a consistent daily cutoff |
| Session high / low | A defined session range gives traders a repeatable boundary to monitor | Specify the session hours and timezone before marking the range |
| Previous week high / low | Prior weekly extremes provide reference levels over a longer window | Extend the previous week's extremes |
| Obvious swing points | A recognised swing may serve as an invalidation point for existing positions | Define a swing rule and mark its wick extreme |
| Round numbers | Order clustering near round numbers has been documented in some FX data | Mark relevant round levels for the instrument being studied |
For intraday FX setups, traders may watch whether price crosses an Asia-session extreme as London activity picks up. Define what "Asia session" means in your plan. Different session windows, broker candle cutoffs and daylight-saving conventions can produce different levels.
The practical filter is simple: choose levels you can identify consistently before the break occurs. Visibility gives you a repeatable reference point. It does not tell you how many orders are there.
The Sweep Test: three conditions
For this article, we use a three-condition Sweep Test to define one version of the setup. All three must be met for a trade to qualify under this framework. Other traders may use different rules.
Condition 1: there was a predefined level to watch
Before the move, a specific level was identified: equal highs, a previous day high or a session low, for example. Record why the level matters and how it was drawn. If you cannot name the level without looking at the later reversal, condition 1 fails.
You can mark levels before the session or as they form during it. The important part is identifying them before the break, with the information available at that time.
Condition 2: price penetrated the level and closed back inside
Price must exceed the level, then close back on the original side within a defined number of candles. Set that number in advance. On a 5-minute chart, a one-to-three-candle window is one possible rule to test, rather than a universal requirement.
For an upside penetration, this means a close back below the marked high. For a downside penetration, it means a close back above the marked low. The return can occur within the penetration candle or on a later candle inside your chosen window.
If price remains beyond the level, it has not met this reversal condition. That does not establish whether the breakout will ultimately succeed.
Condition 3: the return met a predefined speed filter
This version of the setup requires the return to be faster than the approach over the same price distance. That is a filter to investigate, not a fact that defines every liquidity sweep.
Choose a reference point a fixed distance inside the range before the break. Compare the time taken to travel from that point to the level with the time taken to return from the level to that point after the penetration. Use the same distance and a consistent measurement method.
For example, if you compare movement over five pips, measure five pips in both directions. Comparing a long approach with a much shorter return can create the appearance of speed without a fair comparison. Use sufficiently detailed price data to establish the sequence, or record the timing as unavailable.
The Sweep Test, stated as one line: a predefined level, penetration with a close back inside within a preset window, and a return that meets a consistently measured speed filter.
Write those three conditions into your plan. They make the setup measurable. Whether the speed filter improves the result is something your testing still has to establish.
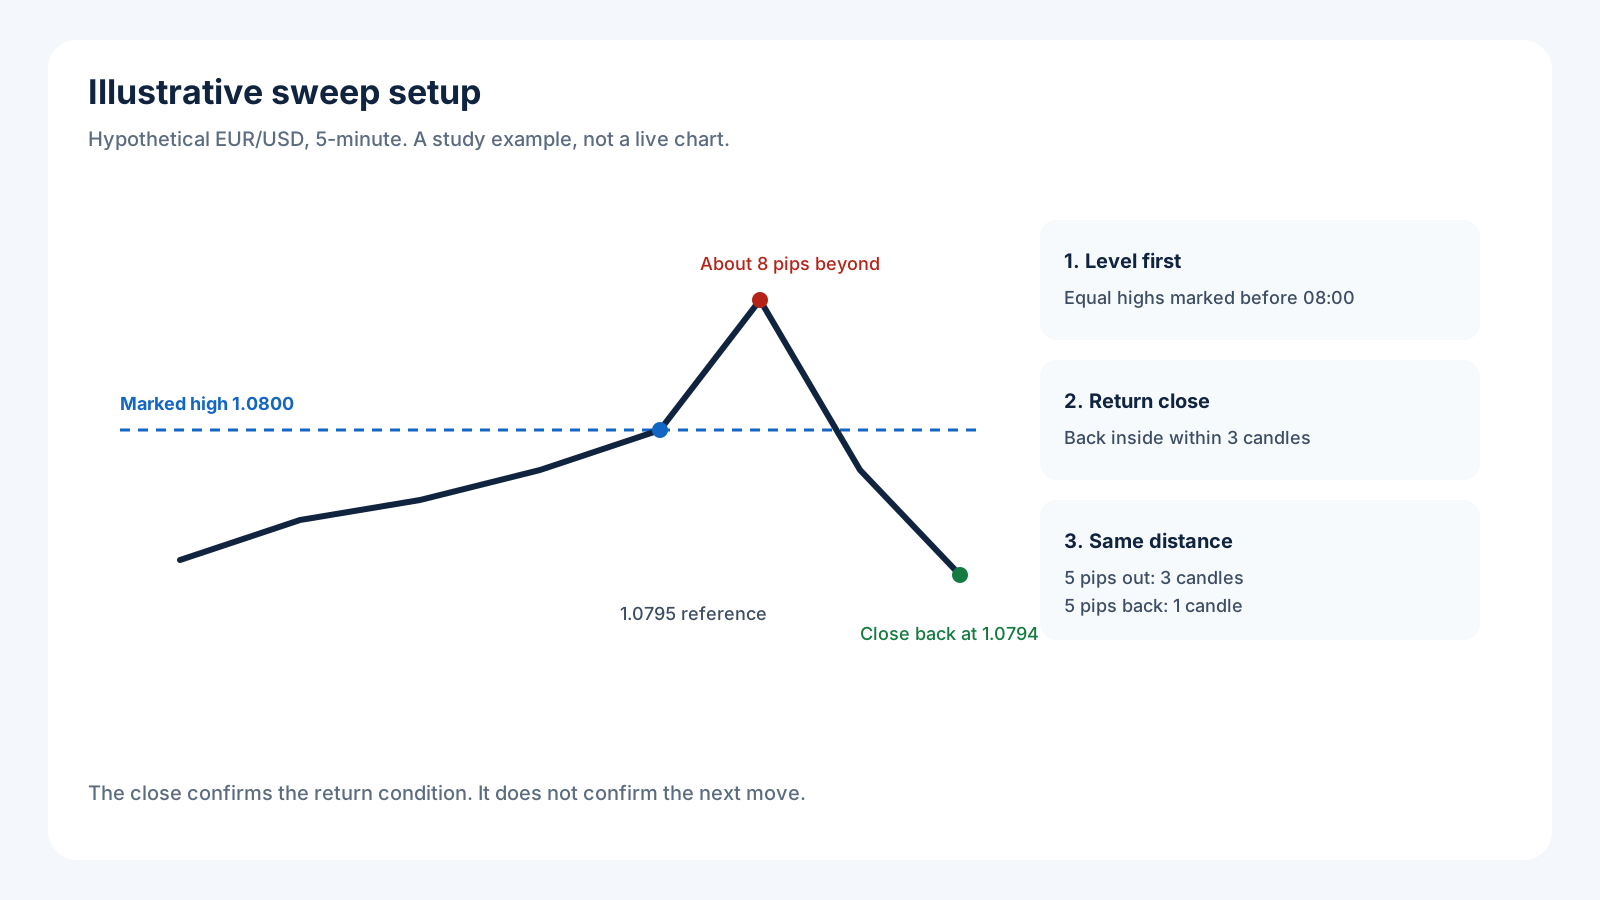
An illustrative 5-minute EUR/USD chart showing the marked level, penetration, return close and equal-distance speed comparison.
Sweep or genuine breakout?
This is the decision that costs money. At the moment a level breaks, you do not know whether price will sustain the move or return inside.
The following observations can help describe what happens next. They are clues to test, rather than a checklist that predicts the outcome with certainty.
| Characteristic | What may support a reversal setup | What may support a continuing breakout |
|---|---|---|
| Candle close | Price closes back on the original side of the level | Price closes beyond the level |
| Follow-through | Price moves farther back into the original range | Price continues beyond the level or consolidates there |
| Volume behaviour | Activity rises around the penetration and changes as price returns | Activity remains elevated as price extends beyond the level |
| Retest behaviour | The original boundary resumes acting as resistance after an upside failure, or support after a downside failure | Former resistance acts as support after an upside break, or former support acts as resistance after a downside break |
| Return speed | Price returns quickly under your chosen measurement rule | Price remains beyond the level rather than quickly reclaiming the original range |
| Higher timeframe context | The reversal entry fits your predefined directional filter | The breakout entry fits your predefined directional filter |
A close beyond a level can still fail. A close back inside can still be followed by another breakout. Some successful breakouts never retest. None of these observations removes the need for an invalidation rule.
Be precise about volume, too. On MetaTrader forex charts, the volume indicator commonly measures ticks or price changes, rather than the total amount traded across the global FX market. Know what your feed measures before using a volume filter. 4
Higher timeframe context is another candidate filter. In a daily downtrend, for example, you might test short entries after price sweeps a local high. Here, the upward penetration is against the daily direction while the short entry is aligned with it. That distinction is clearer than simply calling the entire setup "countertrend."
A worked example
This is a hypothetical EUR/USD setup on a 5-minute chart. For this example, the reference range is 00:00 to 07:59 in the Europe/London timezone, with London activity monitored from 08:00 local time. These are chosen study hours, not a universal definition of the Asia session.
- Before 08:00, the range forms equal highs around 1.0800. The high is marked in advance. A reference point five pips inside the range, at 1.0795, is also recorded. Condition 1 satisfied.
- After 08:00, price travels from 1.0795 to 1.0800 over three candles, then pushes roughly eight pips above the high.
- The following candle closes at 1.0794. The penetration and return close occur within the preset three-candle window. Condition 2 satisfied.
- Detailed price data confirms the faster return. After crossing back below 1.0800, price reaches 1.0795 within one candle, compared with three candles for the approach over the same five-pip distance. Condition 3 satisfied.
- Higher timeframe check. The trader's predefined daily trend rule points down. The short reversal entry therefore passes this plan's directional filter.
- Entry and risk. The plan calls for a short at the next available quote after the return candle closes, with a stop above the sweep high and a target near the opposite side of the reference range. Position size is calculated from the planned stop distance. Spread, slippage and costs are included in the test.
The close confirms that the return-inside condition occurred. It does not confirm that price will keep falling, reach the target or avoid another move above the high. The entry, stop and target are rules being tested, not a guaranteed outcome.
Three mistakes that make sweep results harder to assess
Each of these changes what a sample of sweep trades can tell you.
1. Mixing wick entries with reclaim entries
Entering during the penetration means acting before the return-inside condition has occurred. Waiting for a reclaim gives you that extra information, but can change the entry price, stop distance and available reward.
Neither method has a universal probability of success. They are different entry rules and should be recorded separately. If your plan requires a confirmed return, entering on the wick is also a deviation from the plan, regardless of whether that particular trade wins.
2. Marking the level after the fact
Reviewing a reversal and then drawing the perfect level through it tells you little about whether the setup was identifiable in real time.
Condition 1 requires the level to be defined before the break. Keep a timestamped note, screenshot or test record so you can distinguish a planned setup from a convincing hindsight annotation.
3. Treating every level and session as one setup
An Asia-range high tested as London activity picks up may behave differently from a local swing high tested later in the day. Combining them can hide differences in outcomes.
That does not mean one group must be profitable and the other unprofitable. It means you should identify the groups before deciding whether they deserve the same rules. Tagging level types and sessions separately makes that comparison possible.
How to check whether sweep trades work for you
Your journal can help assess the performance of your sweep rules. It cannot, by itself, prove that institutions targeted stops or that a particular level contained the orders you expected.
The procedure is straightforward. Keep the setup definition stable, separate the entry methods and review the result after costs.
Step 1: tag by level type, not just “sweep”
In a spreadsheet or a journal with custom tagging, such as TraderWaves Pro, create separate tags for each level type:
sweep-EQHandsweep-EQLfor equal highs and lowssweep-PDHandsweep-PDLfor previous day extremessweep-asiafor your defined Asia-range sweepssweep-swingfor general swing points
Add a second tag for entry method: entry-reclaim for entries after a close back inside, and entry-wick for entries during the penetration. Record whether the speed and higher timeframe filters passed, too.
If one trade fits several level types, decide how you will handle the overlap. A trade counted in two groups is still one trade, not two independent observations.
Step 2: start with 30 trades per setup
Thirty is an initial review point, not proof of an edge or a reliable universal cutoff. The amount of evidence needed depends on outcome variability and the size of the advantage you are trying to detect. Statistical sample-size guidance explicitly accounts for the effect being tested and the confidence required. 5
Thirty trades split across several level types, sessions and entry methods can leave very little evidence in each group. Gather more data when the comparisons are too thin to support a useful conclusion.
Keep the rules stable during each test. If you change them, preserve the earlier results and treat the revised rules as a new setup version.
Step 3: check three comparisons
| What to check | What to record | What it tells you |
|---|---|---|
| Performance by level type | Sample size, win rate, average win, average loss and expectancy after costs | Whether particular level types have produced better or worse outcomes under your rules |
| MAE by entry method and outcome | Adverse excursion on eligible trades, using consistent units and separating winners from losers | How much adverse movement each entry method experienced, and whether entry timing or stop placement deserves investigation |
| Performance by session | Expectancy after costs and sample size within consistently defined session windows | Whether observed results differ by session, without assuming the session caused the difference |
MAE measures the most adverse movement or open P&L observed while a trade is open. It includes losing trades as well as winners. A high MAE relative to the initial stop distance can prompt questions, but there is no universal 60% threshold that proves an entry was too early.
Check data coverage before interpreting the chart. TraderWaves' trade-path metrics require sufficient eligible price history, and some trades may be excluded. Missing MAE is not zero MAE. 6
Include commissions, spread, slippage and any applicable financing costs when reviewing performance. Expectancy is the average result per trade. Compare it in R, where 1R is a gain or loss equal to the initial planned risk, so a change in position size does not dominate the comparison.
Step 4: apply one decision rule
Do not keep or remove a setup based on win rate alone.
A setup winning 30% of trades with average winners of 3R and average losers of 1R has an expectancy of 0.2R per trade before costs. A setup winning 60% with average winners of 0.5R and losers of 1R loses 0.1R per trade before costs. Winning more often is not the same as making money on average. 7
Review expectancy after costs, drawdown and whether a small number of trades carry the result. If the evidence is uncertain, record that uncertainty and gather more data rather than forcing a pass or fail.
If you select the strongest level type or remove a filter after studying the results, test the revised plan on a fresh period. The data used to choose the rules should not be your only evidence that those rules work.
This is how a chart pattern becomes a testable trading plan. The journal keeps the rules, observations and results connected.
Sources
- CME Group: Futures Order Types. Explains limit, market and conditional stop orders.
- Federal Reserve Bank of New York: Currency Orders and Exchange-Rate Dynamics. Examines stop-loss and take-profit order clustering in foreign-exchange data.
- Federal Reserve Bank of New York: Stop-Loss Orders and Price Cascades in Currency Markets. Provides evidence that triggered stops can intensify price moves.
- MetaTrader 5 Help: Volume Indicators. Distinguishes forex tick activity from executed trading volume.
- NIST: Sample Sizes Required. Explains how sample requirements depend on the effect, significance level and statistical power.
- TraderWaves Help: MFE, MAE and Exit Quality Metrics. Explains trade-path metrics and data-coverage limitations.
- CME Group: The Mathematics of Trading Success. Explains mathematical expectation and the relationship between win frequency and win/loss size.
Start measuring instead of guessing
Naming a sweep is easy. Knowing whether your version makes money takes explicit rules, consistent records and enough data to judge the result with some confidence.
Mark the level before the break, record how you entered and review expectancy after costs. Treat the first sample as a starting point, then check whether the findings survive fresh data.
Start free with TraderWaves for unlimited journaling, unlimited screenshots and supported broker connections across 700+ compatible brokers and exchanges. No credit card, free permanently. For custom tags and advanced analysis, explore TraderWaves Pro.
Educational content only. This article is for educational purposes and is not financial advice, a recommendation, or an offer to trade. Trading carries risk of loss. TraderWaves is operated by Wallace FX Ltd, London, United Kingdom.
What is a liquidity sweep in simple terms?
In SMC reversal trading, it usually means price briefly moving beyond a recognised high or low and then returning inside. Traders often associate the move with stop orders near the level, but the chart alone does not establish that stops were triggered or that a large participant deliberately caused the reversal.
How do I know if it is a liquidity sweep or a real breakout?
You cannot know the eventual outcome at the moment price crosses the level. Define the behaviour you require for your setup, such as a return close within a preset window, then assess it as information arrives. A close inside confirms that condition, while a sustained move beyond the level supports a continuing-breakout interpretation. Either can later fail.
What timeframe works best for trading liquidity sweeps?
There is no universal best timeframe. Some traders mark 1-hour or daily levels and use a 5-minute or 15-minute entry chart. Others define both the level and entry on the same timeframe. Choose a pairing that gives you clear rules, accounts for trading costs and can be tested consistently.
Is a liquidity sweep the same as a stop hunt?
The terms overlap in trading discussions, but "stop hunt" implies deliberate targeting. "Liquidity sweep" can describe the chart pattern without establishing intent. Usage varies, so define the behaviour you mean rather than relying on the label alone.
Ready to journal?
Start Tracking Your Trades Today
Sign up now and access advanced trade journaling tools for free.
Start Free: No Credit Card