Free Trading Journal Template for
Google Sheets (2026) + Setup Guide

A trading journal template for Google Sheets logs each trade's entry, exit, size, stop and outcome, then calculates win rate, R-multiple and expectancy automatically. Download the free template below, or skip manual entry entirely with automatic imports from supported platforms.
Start here, not with the theory
The template is above. Take it, copy it, start logging. Everything below explains why it is built the way it is, how to set it up, and where it will eventually stop being enough.
If you are here, you have probably already decided you need a trading journal. That decision is the hard part and you have made it. What is left is choosing a format, and a spreadsheet is a perfectly reasonable place to begin. It costs nothing, it works offline, and you own the file.
Most traders find the same thing after a few weeks, though: the spreadsheet was never the hard part either. Logging consistently is. That is worth understanding before you invest a weekend building something elaborate, so the last section of this article is honest about where the format breaks and what to do at that point.
The 12 columns every trading journal needs
Trading journal templates fail in two directions. Too little structure leaves you with very little to analyse. Too much and you stop filling it in by Wednesday.
These twelve columns are a focused set for useful analysis. Every one earns its place by feeding a calculation or a filter you can actually use.
| # | Column | Format | Why it is included |
|---|---|---|---|
| 1 | Date and time | Datetime | Enables session and time-of-day analysis. Date alone is not enough. |
| 2 | Instrument | Text | Shows whether results vary by market. |
| 3 | Direction | Long / Short | Helps reveal directional bias. |
| 4 | Session | Asia / London / New York / Overlap | Makes session-level review possible. |
| 5 | Setup tag | Controlled list | Shows which repeatable setup is actually working. |
| 6 | Entry price | Number | Feeds the R-multiple calculation. |
| 7 | Stop price | Number | Defines the initial risk unit. |
| 8 | Target price | Number | Compares planned reward with realised reward. |
| 9 | Exit price | Number | Records the realised exit. |
| 10 | Position size | Number | Shows whether your sizing changes after wins or losses. |
| 11 | R-multiple | Formula | Normalises each result to one comparable unit. |
| 12 | Notes and screenshot | Text, link or in-cell image | Preserves the context behind the trade. |
Column 5, setup tag, is the highest-value column in the journal and the one most often filled in carelessly. Free text can turn “breakout”, “Breakout” and “break out” into separate categories. Use Data → Data validation to enforce a dropdown from a fixed list.
Column 11, R-multiple, expresses each result as a multiple of initial price risk. That makes a 40-pip result on EUR/USD and a 900-point result on NAS100 directly comparable.
The three formulas to paste in
Column letters below match the downloadable template.
1. R-multiple (column K)
This guarded version handles long and short trades, leaves incomplete rows blank, rejects an invalid direction, and flags a stop placed on the wrong side of the entry:
=IF(OR(C2="",F2="",G2="",I2=""),"",IF(OR(AND(C2="Long",G2>=F2),AND(C2="Short",G2<=F2),AND(C2<>"Long",C2<>"Short")),"CHECK DIRECTION/STOP",IF(C2="Long",(I2-F2)/(F2-G2),(F2-I2)/(G2-F2))))Where C = direction, F = entry, G = initial stop and I = exit.
Example: Entering EUR/USD long at 1.0850 with an initial stop at 1.0830 and an exit at 1.0910 gives:
R = (1.0910 − 1.0850) / (1.0850 − 1.0830) = +3.00RA result of +2.0R means the price-based outcome was twice the initial price risk. A result of −1.0R is a clean stop-out. This simple formula excludes spreads, commission, slippage and financing, and assumes one entry, one exit and unchanged position size.
A loss below −1R can result from moving the stop, but it can also come from a gap or slippage. Investigate it rather than assuming the cause.
2. Win rate
=IFERROR(COUNTIF(K2:K1000,">0") / COUNT(K2:K1000), "")Format the result as a percentage. It is straightforward—and less useful than many traders expect when viewed alone.
3. Expectancy in R
=IFERROR(AVERAGE(K2:K1000), "")Expectancy is conventionally written as:
Expectancy = (Win rate × Average win) − (Loss rate × Average loss)
When every recorded trade is expressed in R-multiples, that reduces to the arithmetic mean of the R column. A positive average R describes the sample you recorded; it does not guarantee future profitability.
The breakeven relationship is still worth understanding:
Breakeven R:R = (1 − Win rate) / Win rate| Win rate | Minimum average win/loss ratio needed to break even |
|---|---|
| 30% | 2.33 |
| 40% | 1.50 |
| 50% | 1.00 |
| 60% | 0.67 |
| 80% | 0.25 |
An 80% win rate can still lose money if the average loss is more than four times the average win. That is the profile of a trader who repeatedly takes small profits while allowing losses to grow.
Setting it up in Google Sheets
- Make your copy. Open the template, then choose File → Make a copy. No TraderWaves signup is required. Google normally requires you to sign in to a Google account to create your own Sheets copy.
- Set your account details. In the Settings tab, enter account size and risk per trade. The sheet calculates the currency amount represented by 1R; it does not calculate instrument-specific position size.
- Replace the setup tags. Edit the list in Settings!A9:A18. The dropdown in Trade Log column E updates from that range. Keep the first version short.
- Log one long and one short trade. Confirm the R-multiple in column K calculates correctly, and make sure the initial stop is below a long entry or above a short entry.
- Add screenshots. You can paste a shared Drive link into column L or use an in-cell image. Links keep the log compact; in-cell screenshots keep the visual beside the trade.
- Use the Dashboard and weekly review. Dashboard metrics fill as you log. Record the weekly review fields every Sunday so the sheet becomes a trend rather than a pile of rows.
The workbook also includes an Equity Curve tab. Its formulas are pre-filled for 60 trades; drag the final prepared row down to extend it. Dashboard formulas already read through row 1000.
Where a spreadsheet stops working
This section is here because you may hit these limits, and knowing about them in advance is more useful than discovering them at trade 60.
Data entry is unforgiving. Each trade needs around ten manual fields. A twenty-trade week can mean roughly two hundred data-entry actions, often completed when you are tired and least inclined to be careful.
Screenshots need a workflow. Google Sheets supports in-cell images and links to files elsewhere. Both work, but a large library of charts can make the sheet heavy or leave review spread across many Drive tabs.
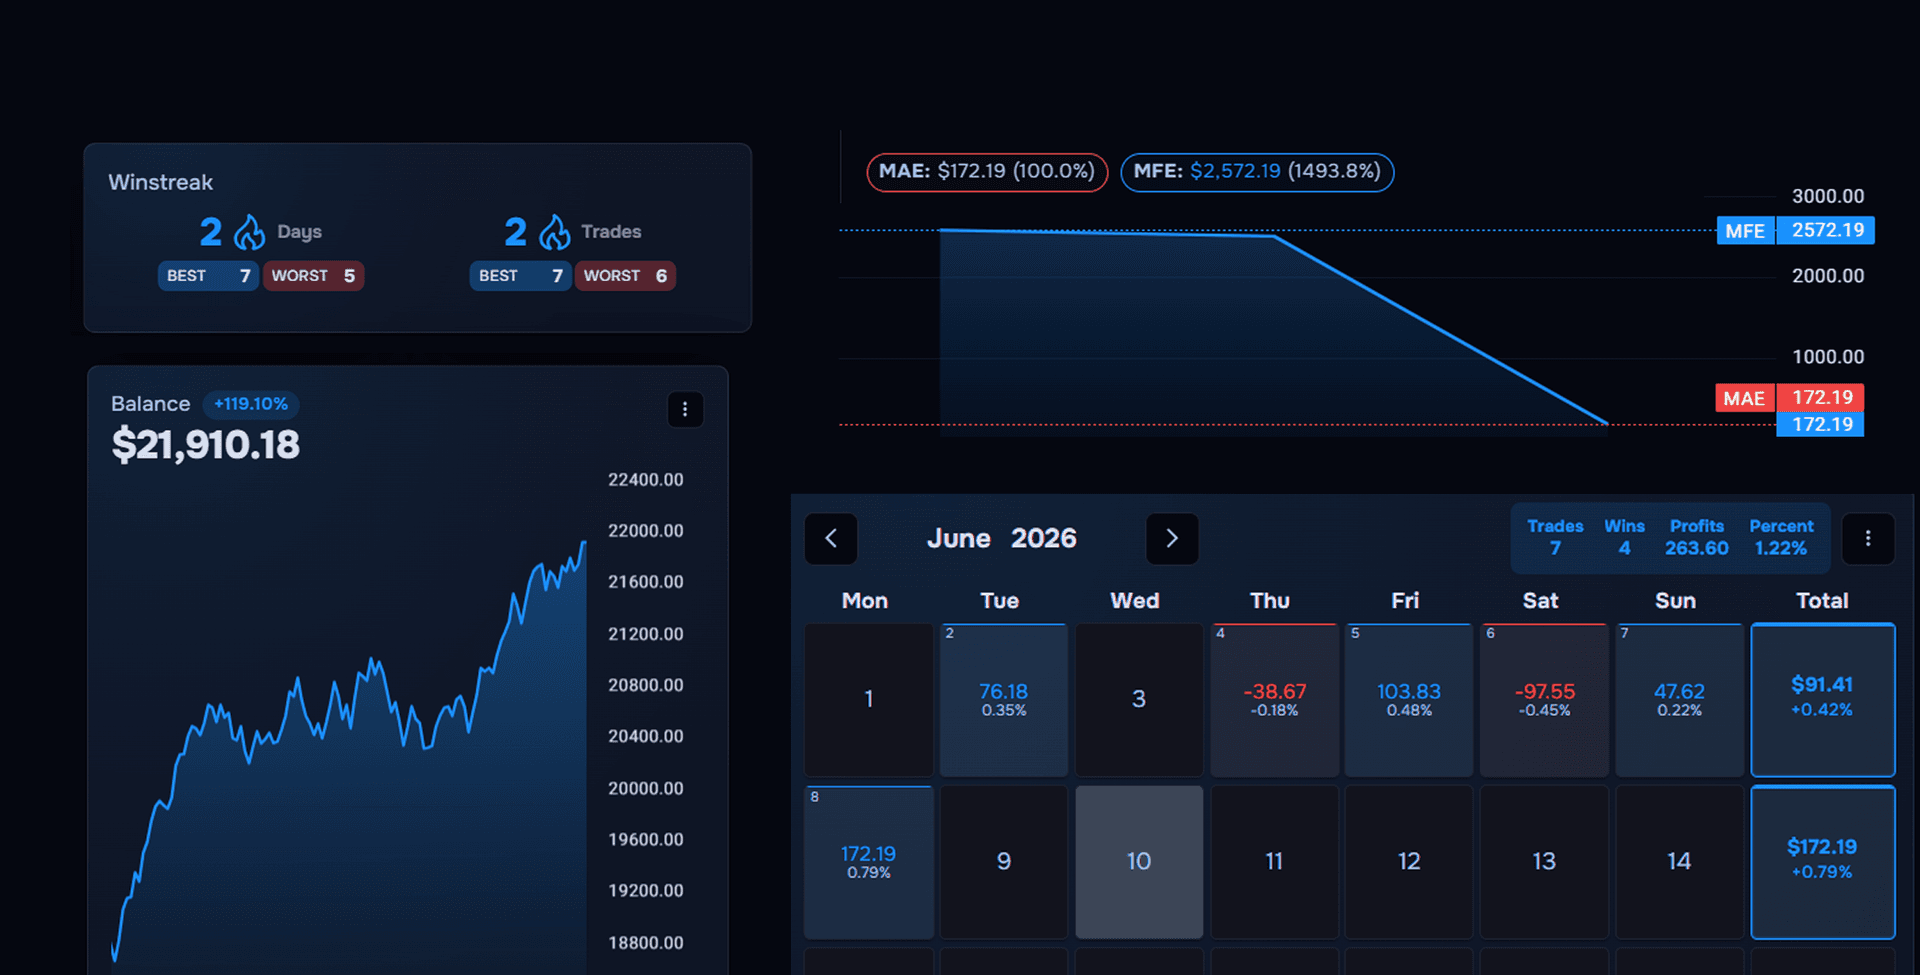
MAE and MFE require additional price data. Maximum Adverse Excursion and Maximum Favourable Excursion depend on the price path while a trade was open. The twelve-column log does not contain that path, so it cannot calculate them without importing or recording additional market data.
Formula maintenance is real, but predictable. Inserting a column does not normally break standard spreadsheet references because Sheets adjusts them. Errors are more likely when formulas are replaced, deleted, pasted over or extended inconsistently. Protect calculated columns and check formulas after structural edits.
Multiple accounts add reconciliation. You can use separate sheets or add account, currency and contract fields, but comparisons become more complex.
Multi-dimensional analysis takes setup. Questions such as “What is my win rate for breakout setups during London on EUR/USD?” are answerable with filters, formulas or pivot tables. The problem is not possibility; it is whether the friction stops you asking the question regularly.
Spreadsheet versus automatic journal
| Capability | Google Sheets template | TraderWaves |
|---|---|---|
| Cost | Free | Free plan available permanently; no card required |
| Trade entry | Manual | Automatic import where available across 700+ compatible brokers and exchanges, plus CSV and manual entry |
| Trade limit | Unlimited | Unlimited journal entries |
| Screenshots | Links or in-cell images | Unlimited images attached to journal entries |
| R-multiple and expectancy | Yes, with formulas | Calculated automatically |
| MAE / MFE | Requires additional price data | Journal Charts with MAE/MFE on Pro |
| Equity curve | Included; extend formulas as needed | Automatic analytics |
| Multi-filter analysis | Filters, formulas or pivot tables | Purpose-built filters |
| Multiple accounts | Manual reconciliation | Up to three connected accounts on Free; Portfolio Journal is Pro |
| CSV export | You own the spreadsheet file | Journal CSV export is Pro |
| Offline use | Available with Google offline access configured | Requires a connection |
The spreadsheet wins on direct file ownership and flexible offline access. A purpose-built trading journal reduces manual work and adds context that depends on connected trade and price data.
Your verification step
Use the template for one month. Then check two things:
- What does the average of your R column show? Treat it as a description of the trades you recorded, not a promise of what comes next.
- How many trades did you actually log? If the sheet has gaps, any conclusion may be biased toward the trades you remembered or wanted to record.
If manual entry is creating the gaps, that is the signal to automate rather than blame discipline.
Conclusion
Take the spreadsheet. Copy the free Google Sheets trading journal template and start logging today. No TraderWaves signup is required.
Or skip the data entry. Start free with TraderWaves and use automatic imports where supported, CSV or manual entry, with unlimited journal notes and screenshots. Pro adds Journal Charts with MAE/MFE, Portfolio Journal and CSV export.
Educational content only. This article is not financial advice, a recommendation or an offer to trade. Trading carries risk of loss.
Is this Google Sheets trading journal template really free?
What should a trading journal template include?
Can Google Sheets calculate my trading expectancy?
Should I use a spreadsheet or a trading journal app?
Ready to journal?
Start Tracking Your Trades Today
Sign up now and access advanced trade journaling tools for free.
Start Free: No Credit Card