CHARTS
See every trade in context
Charts built for real trading analysis, not isolated candles.
Analyze the market, your entries, news events, indicators, and journal notes in one view so you can understand what moved price and why your decision worked or failed.
MORE THAN CHARTING
Charts built for better decisions
Go beyond charting alone. Analyse price in real time, understand what moved the market, review your trades in context, and stay alert without jumping between tools.
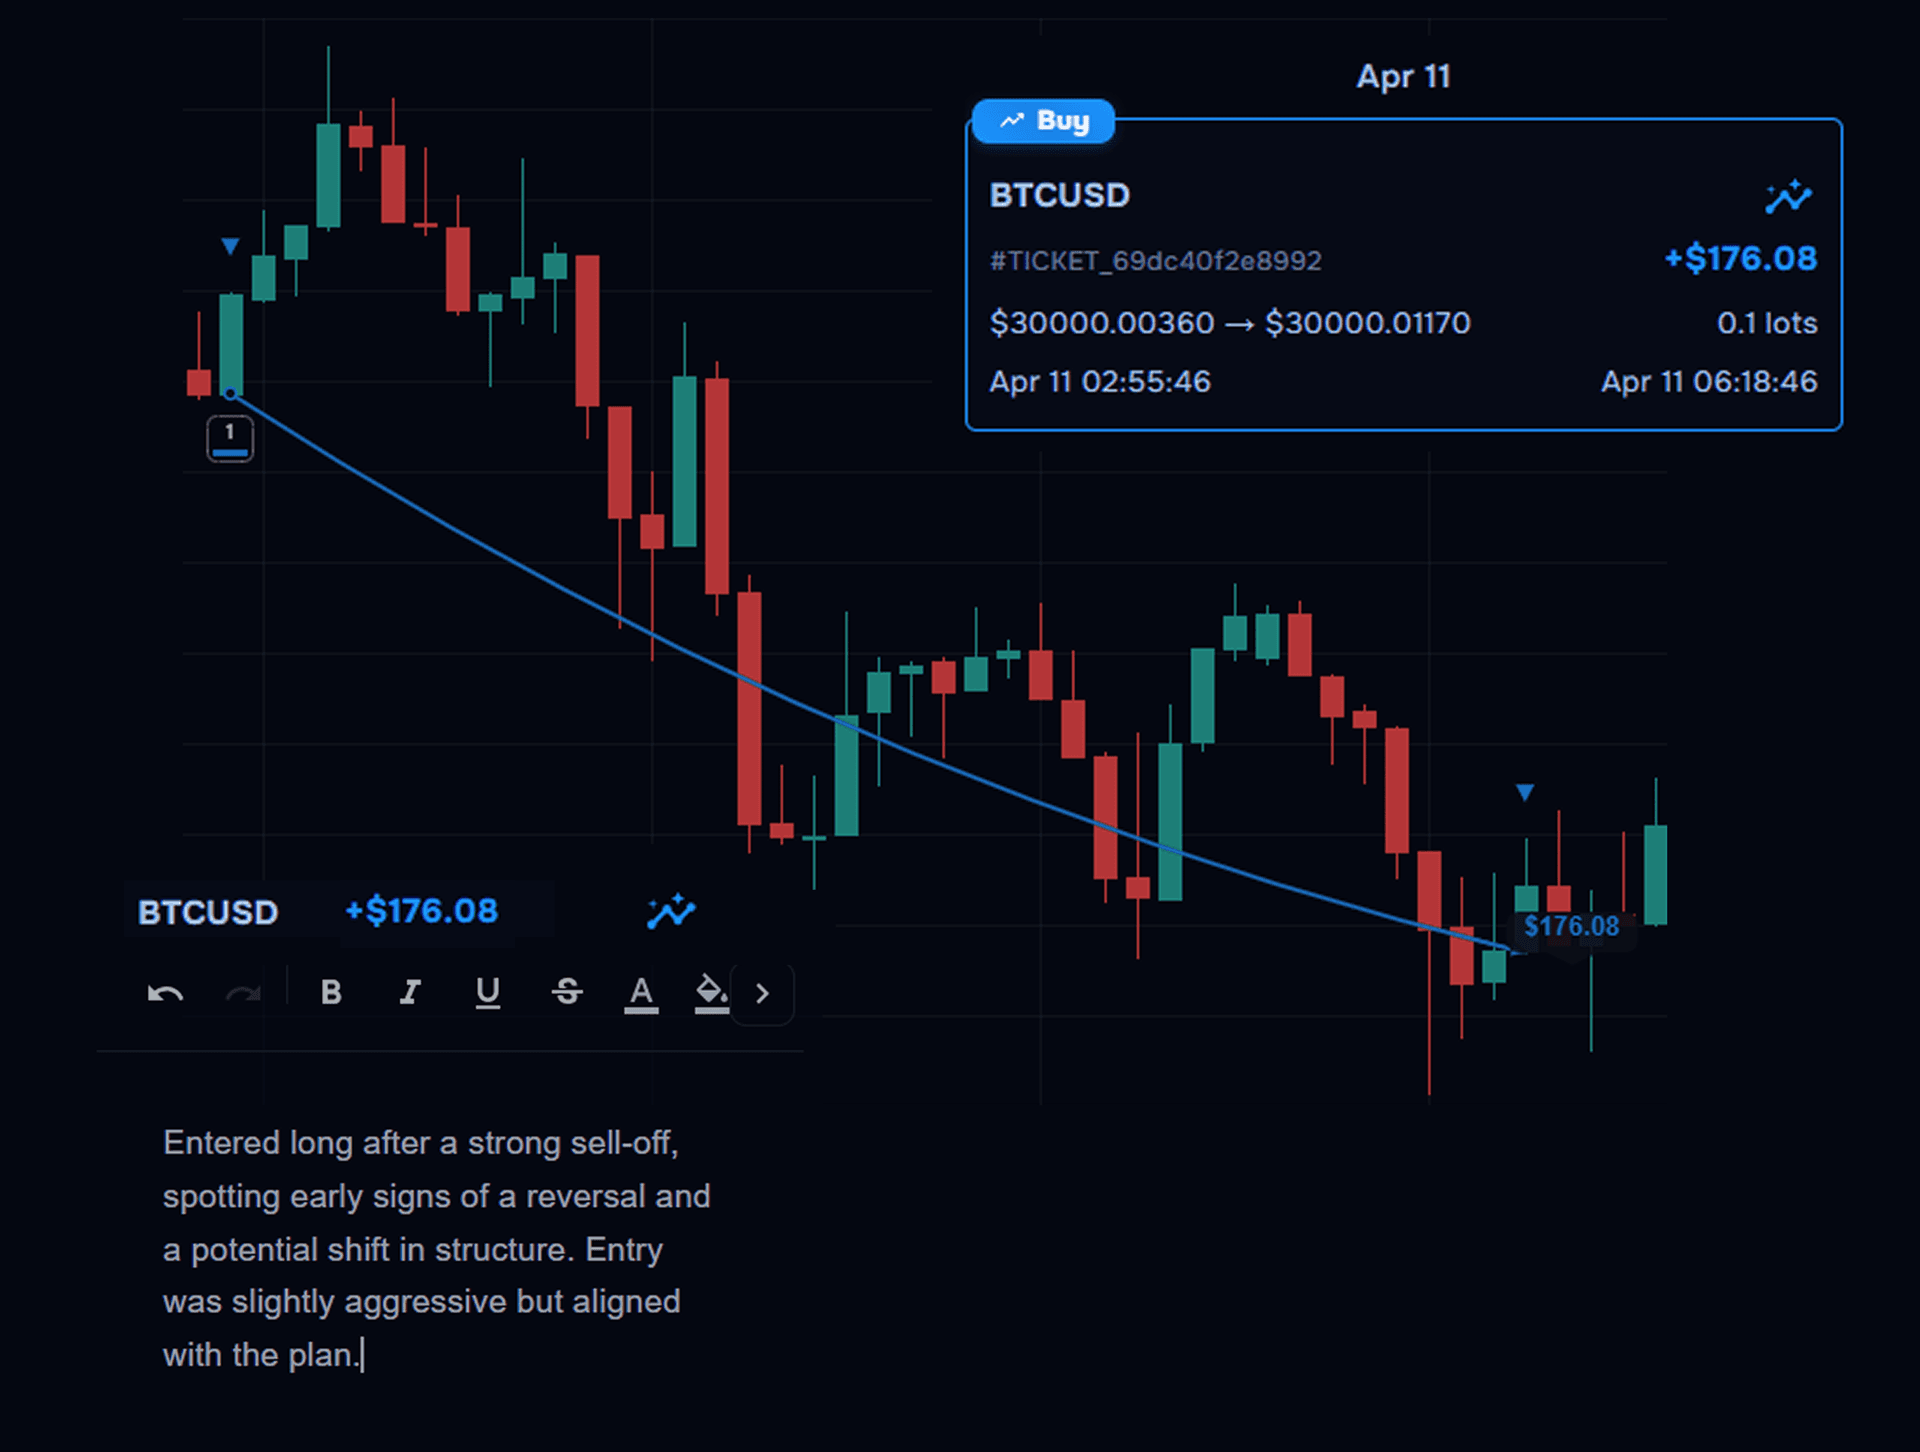
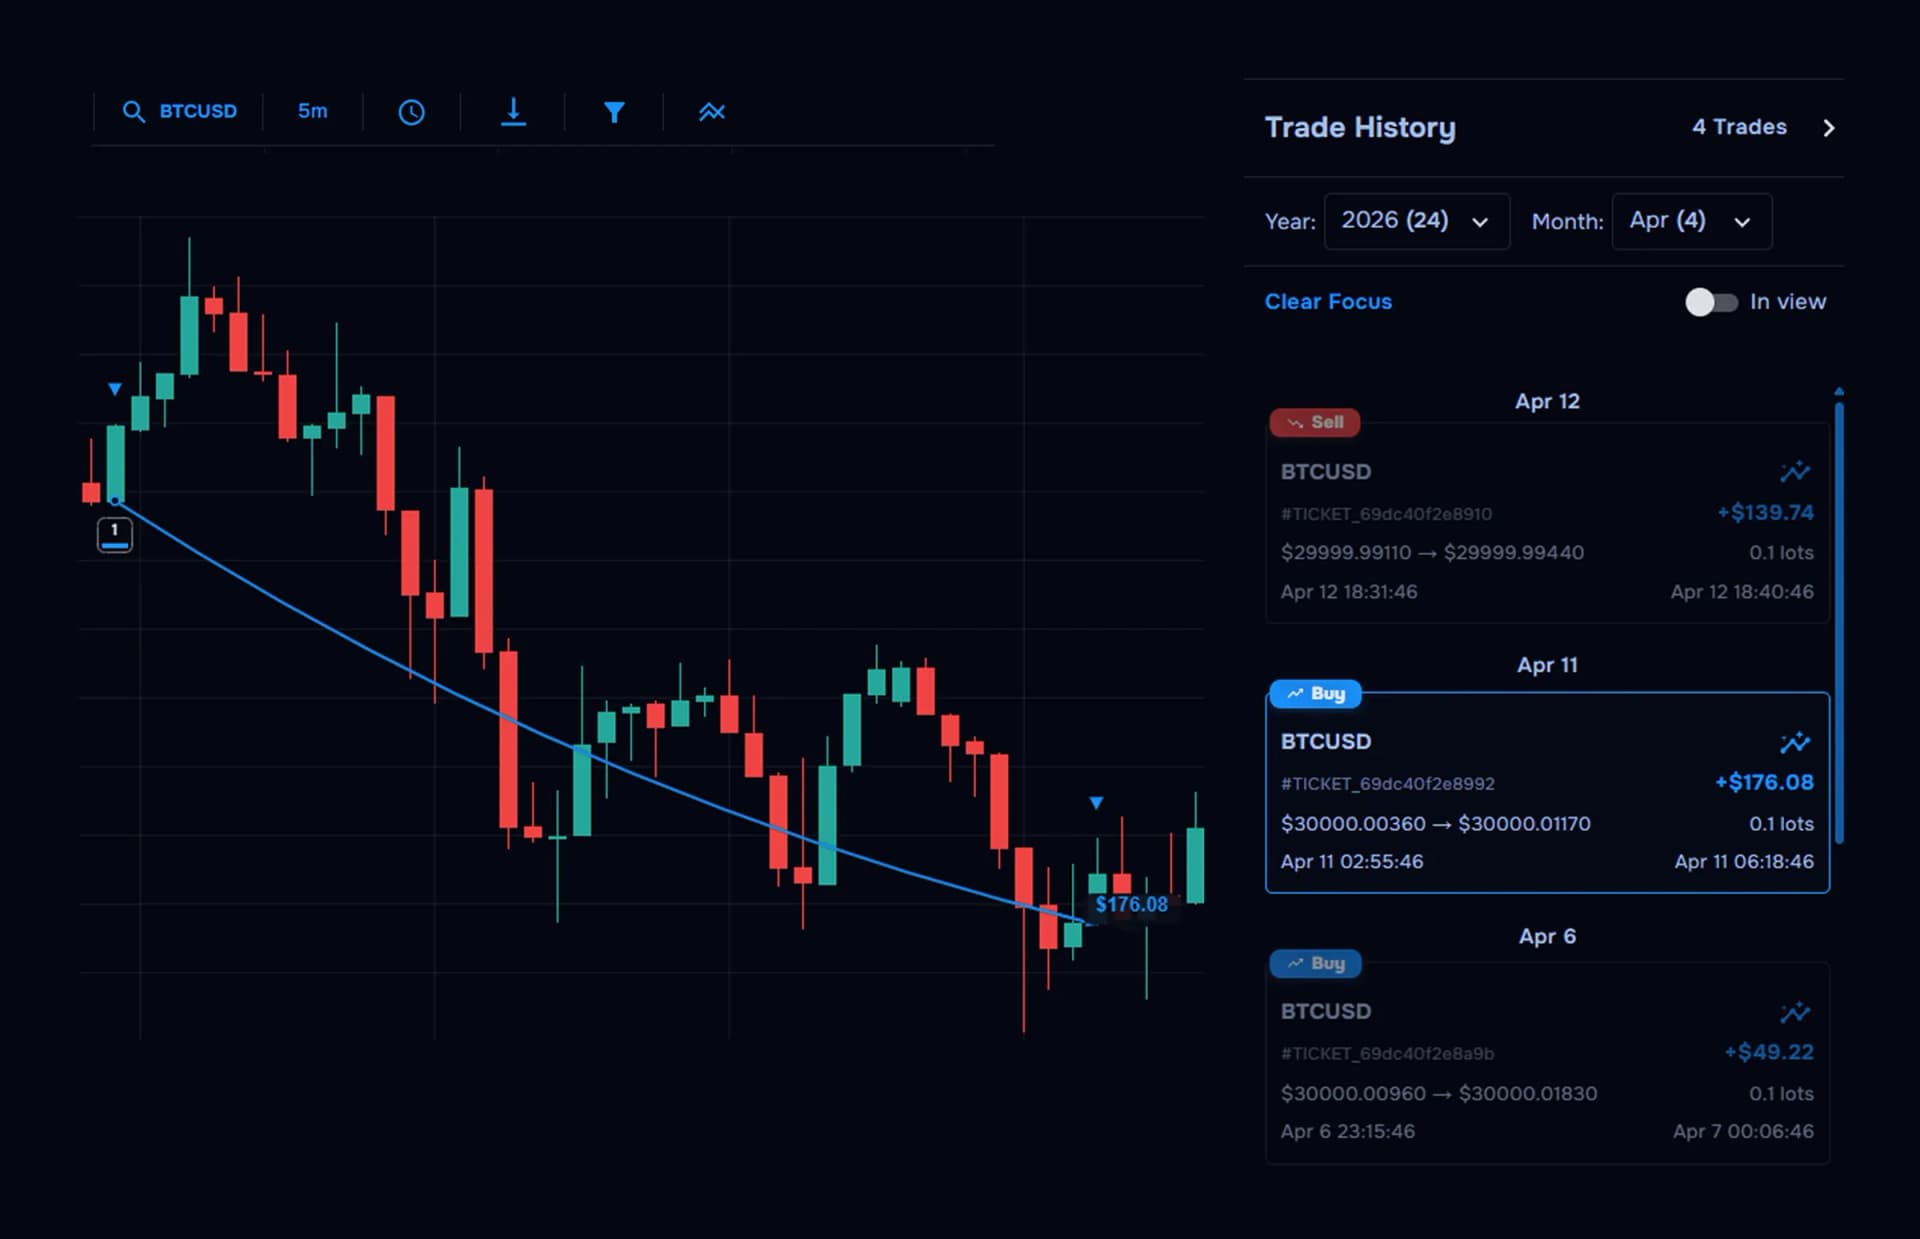
See exactly how your trades played out
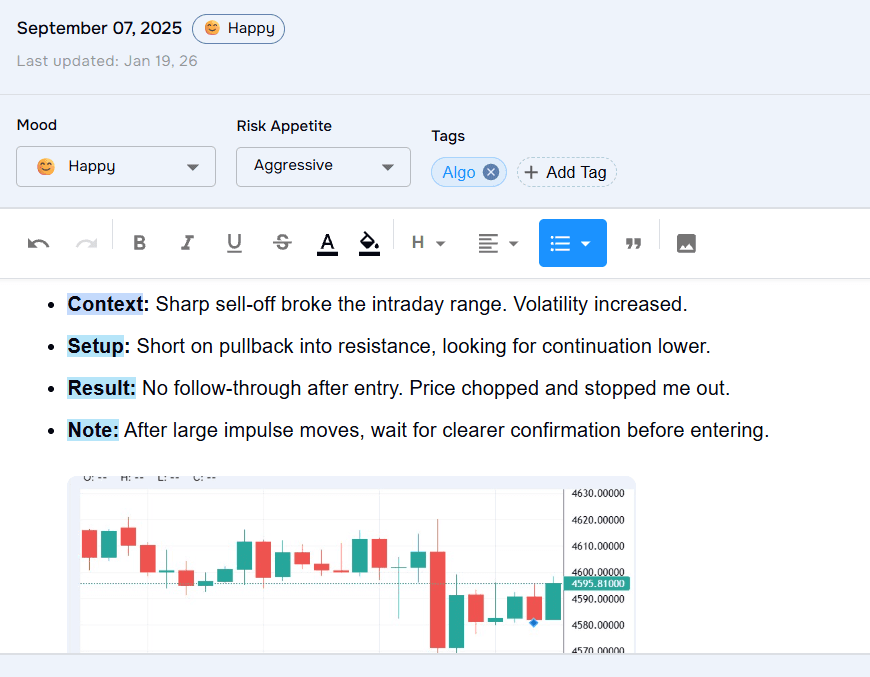
Analyse your trades in the exact context they happened. View real executions on the chart, journal without leaving the workspace, and review timing, structure, and execution more clearly.
- View your real buy and sell trades directly on the chart
- Journal each trade from within the chart workspace
- Apply trade filters such as buy only or sell only
- Review timing, structure, and execution in one timeline
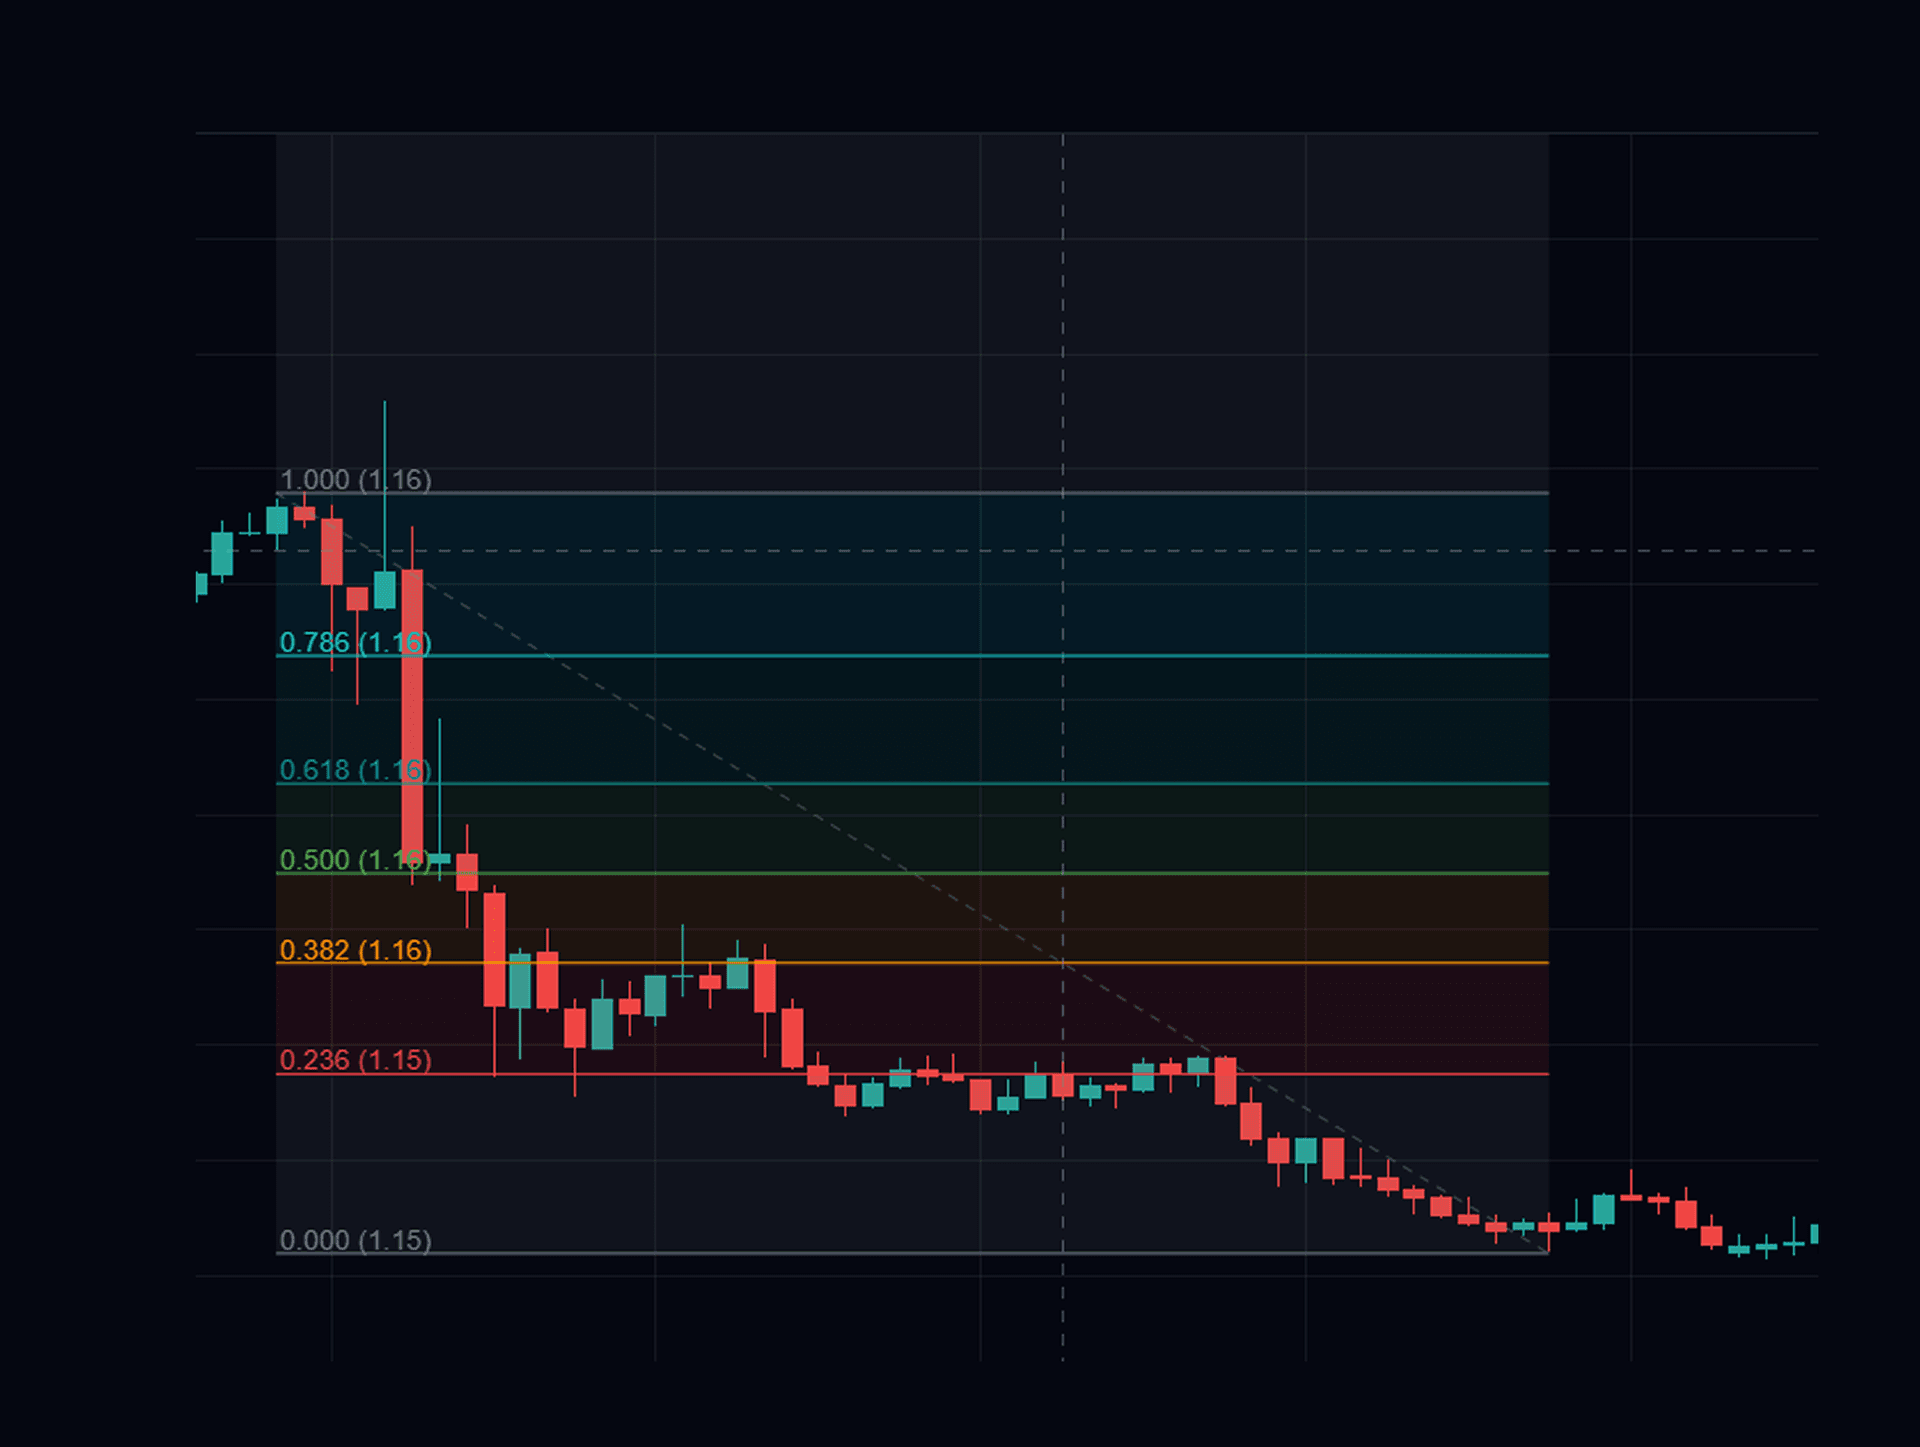
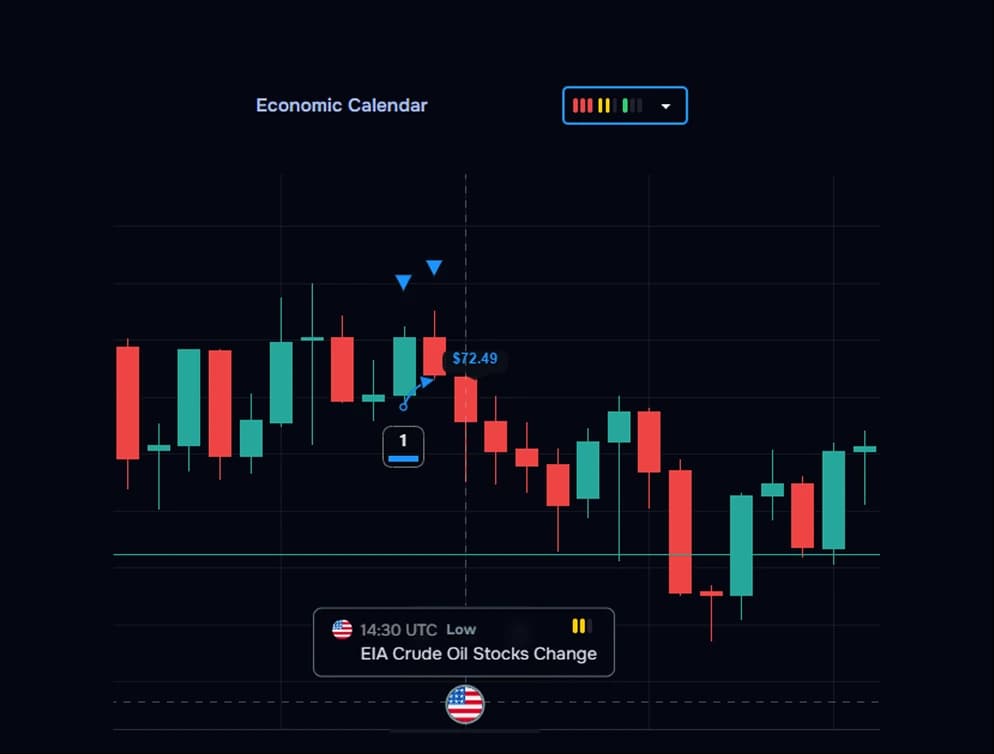
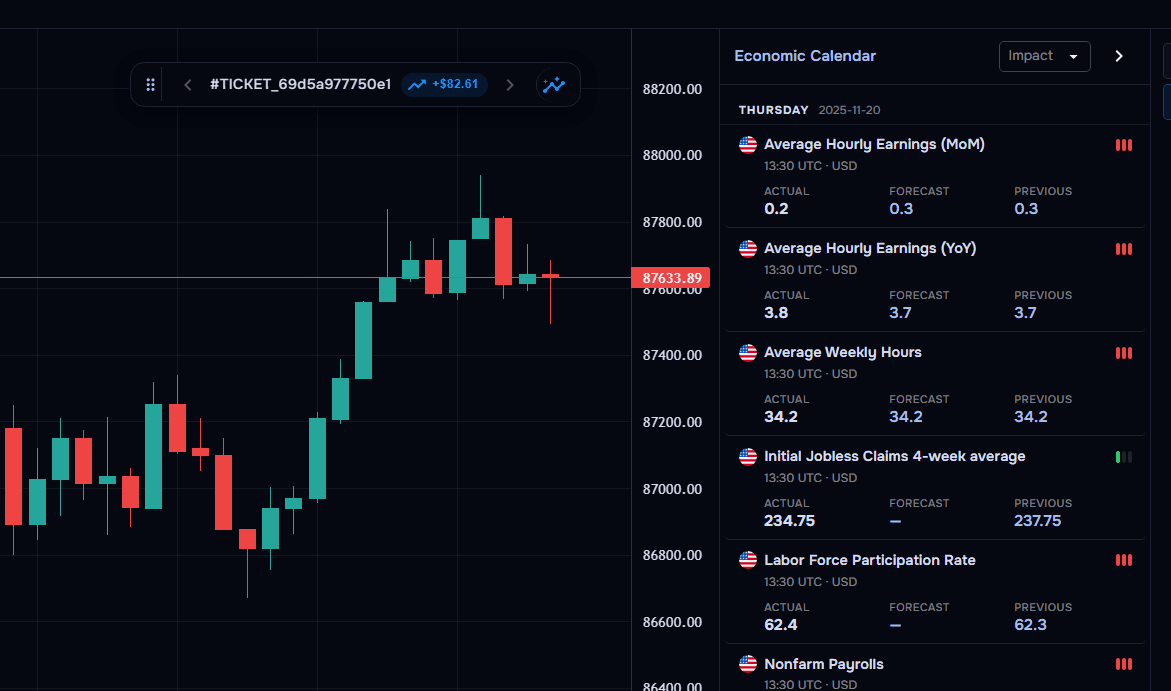
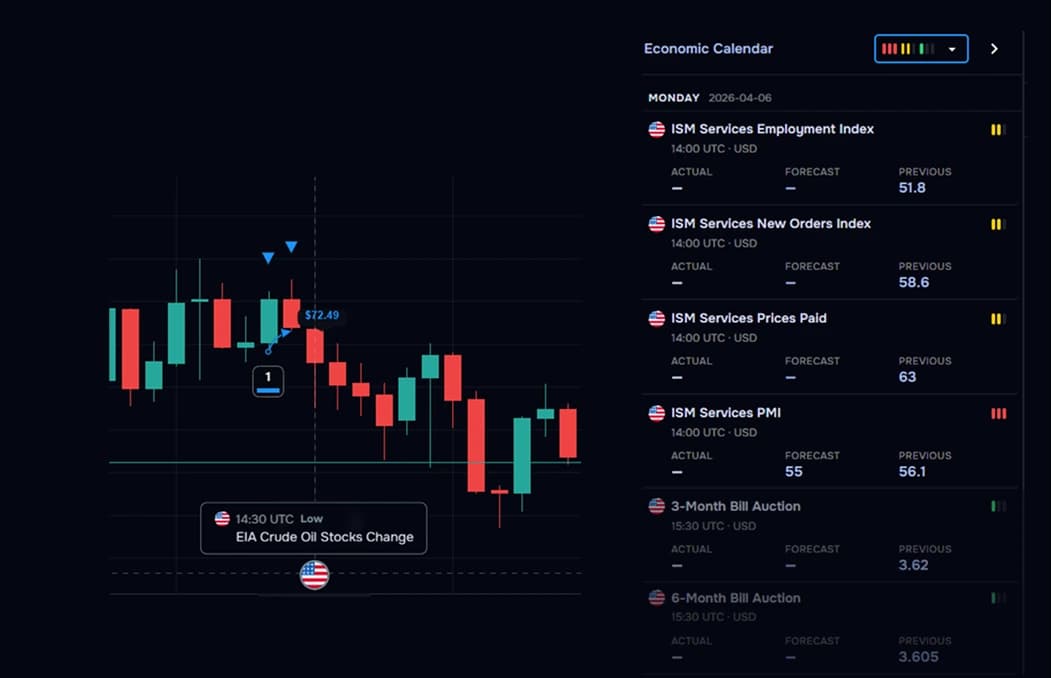
Understand what moved price
See market-moving events directly on your chart so you stop guessing why price moved. Built-in economic events and session timing add context to every setup.
- Use the built-in economic calendar and news events feed
- Filter events by high, medium, and low impact
- See event markers on the chart when news occurred
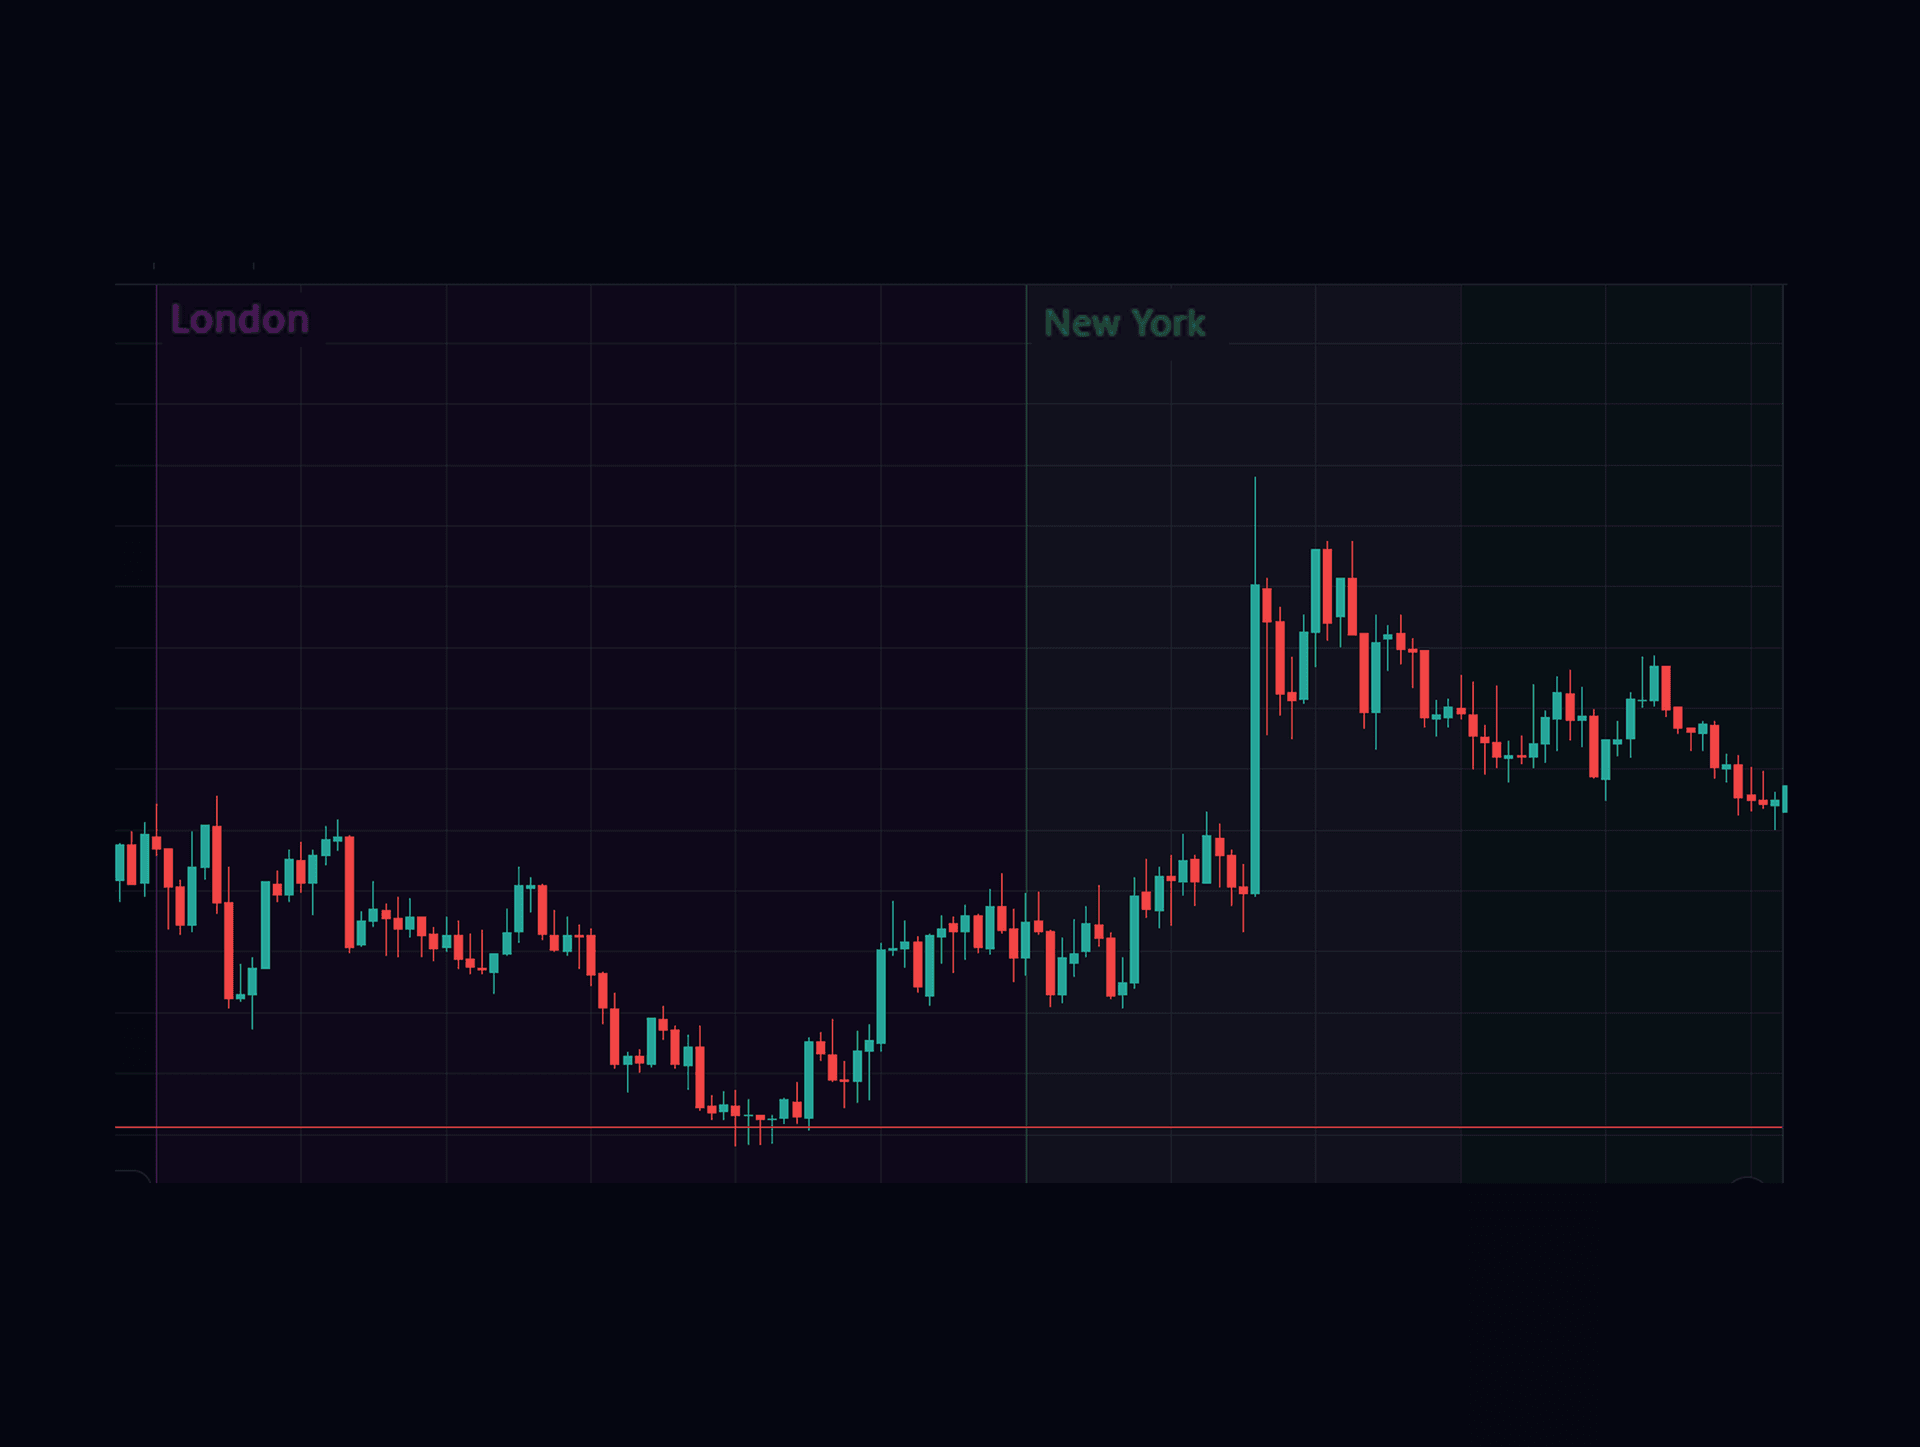
- Track session open and close times for clearer context
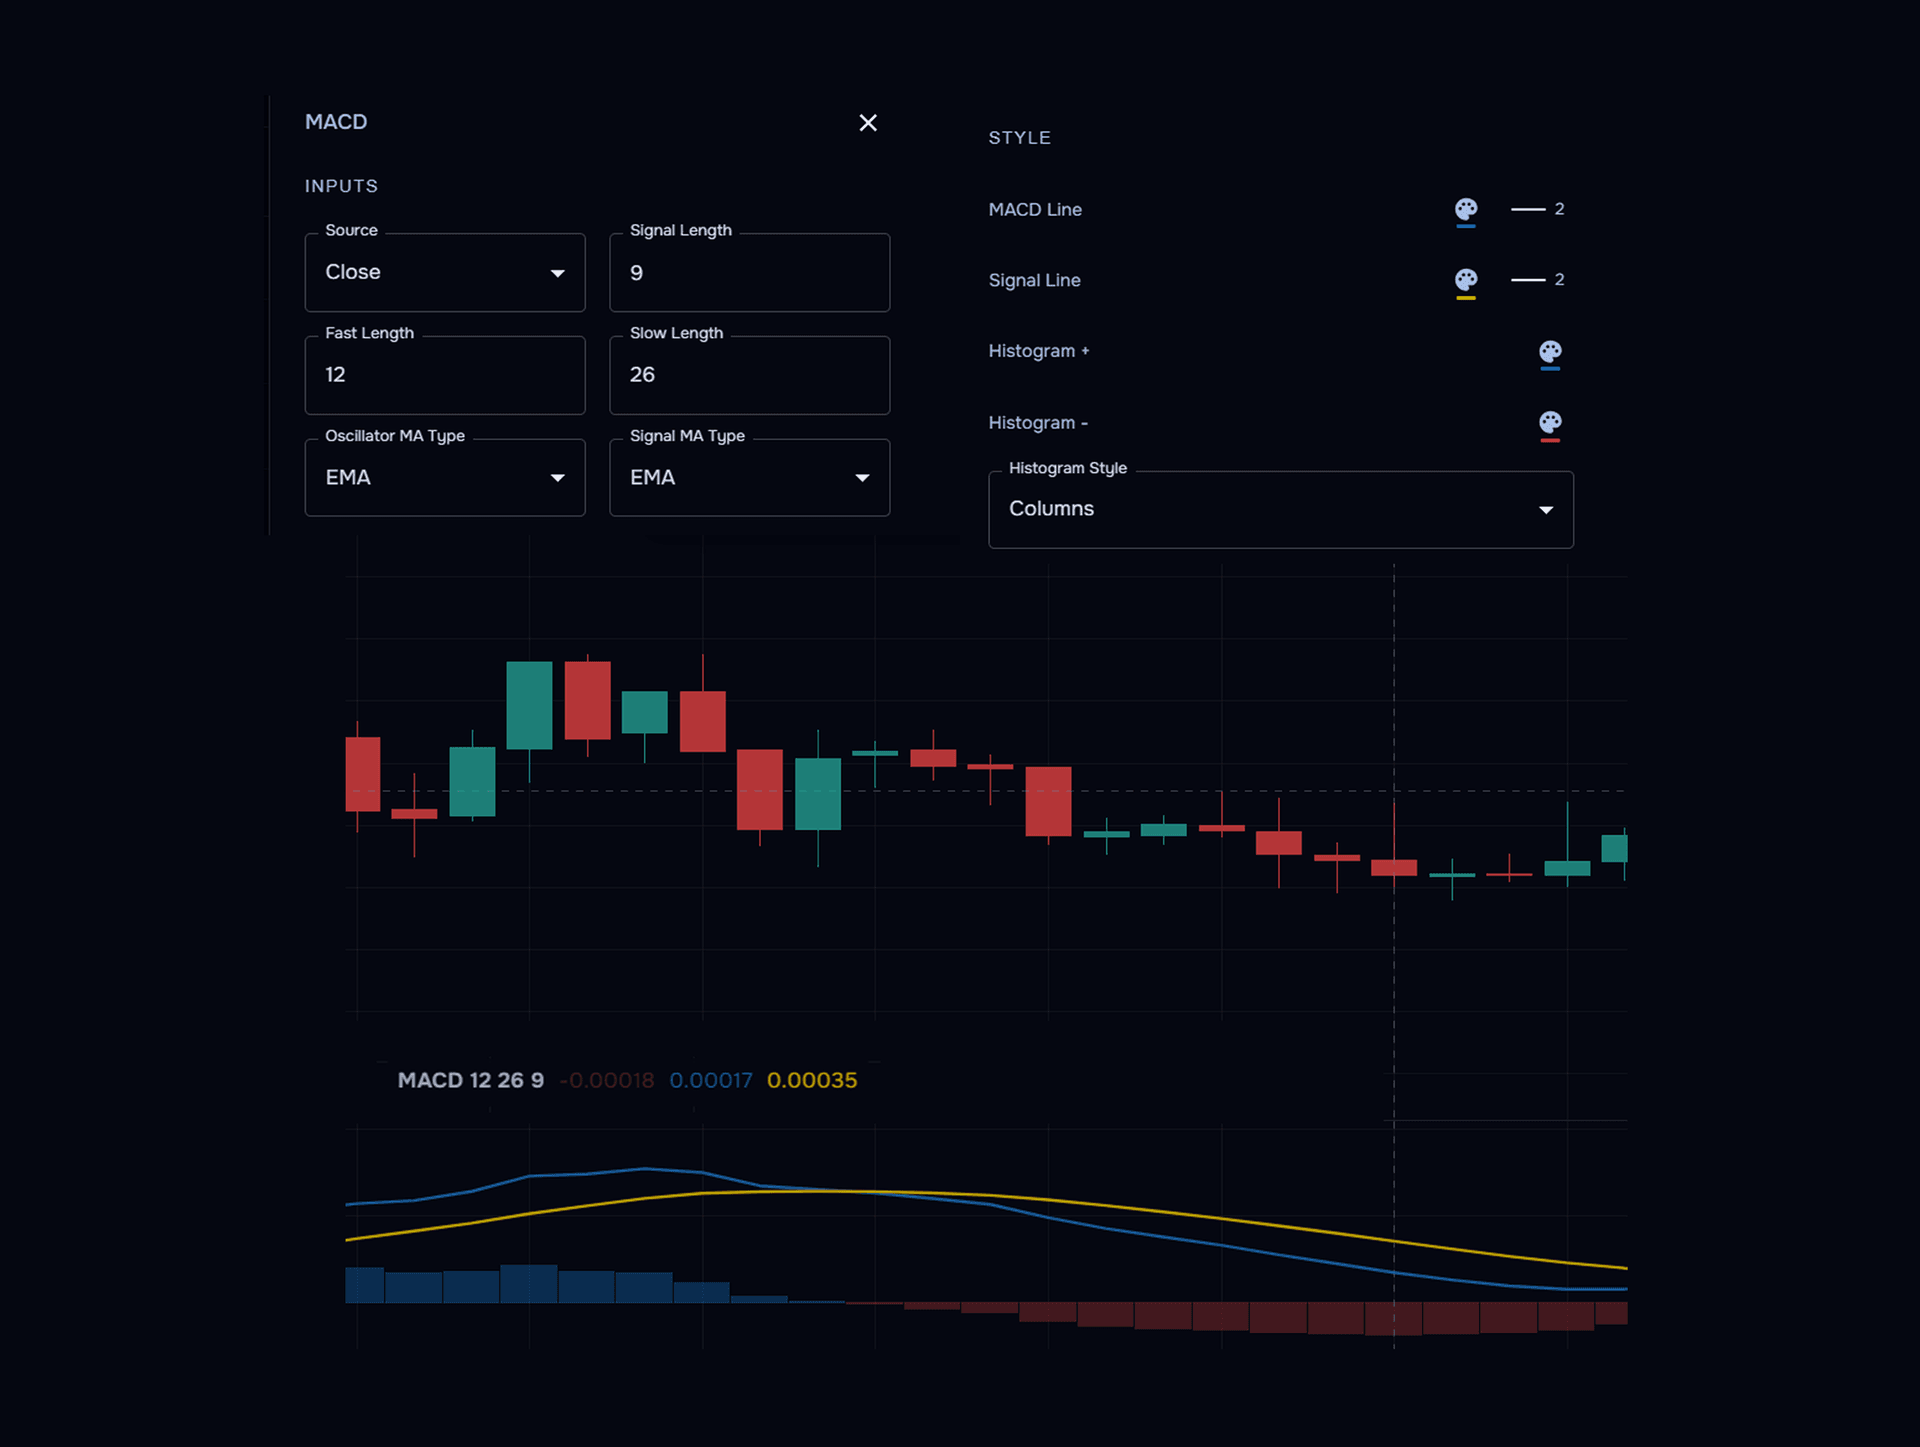
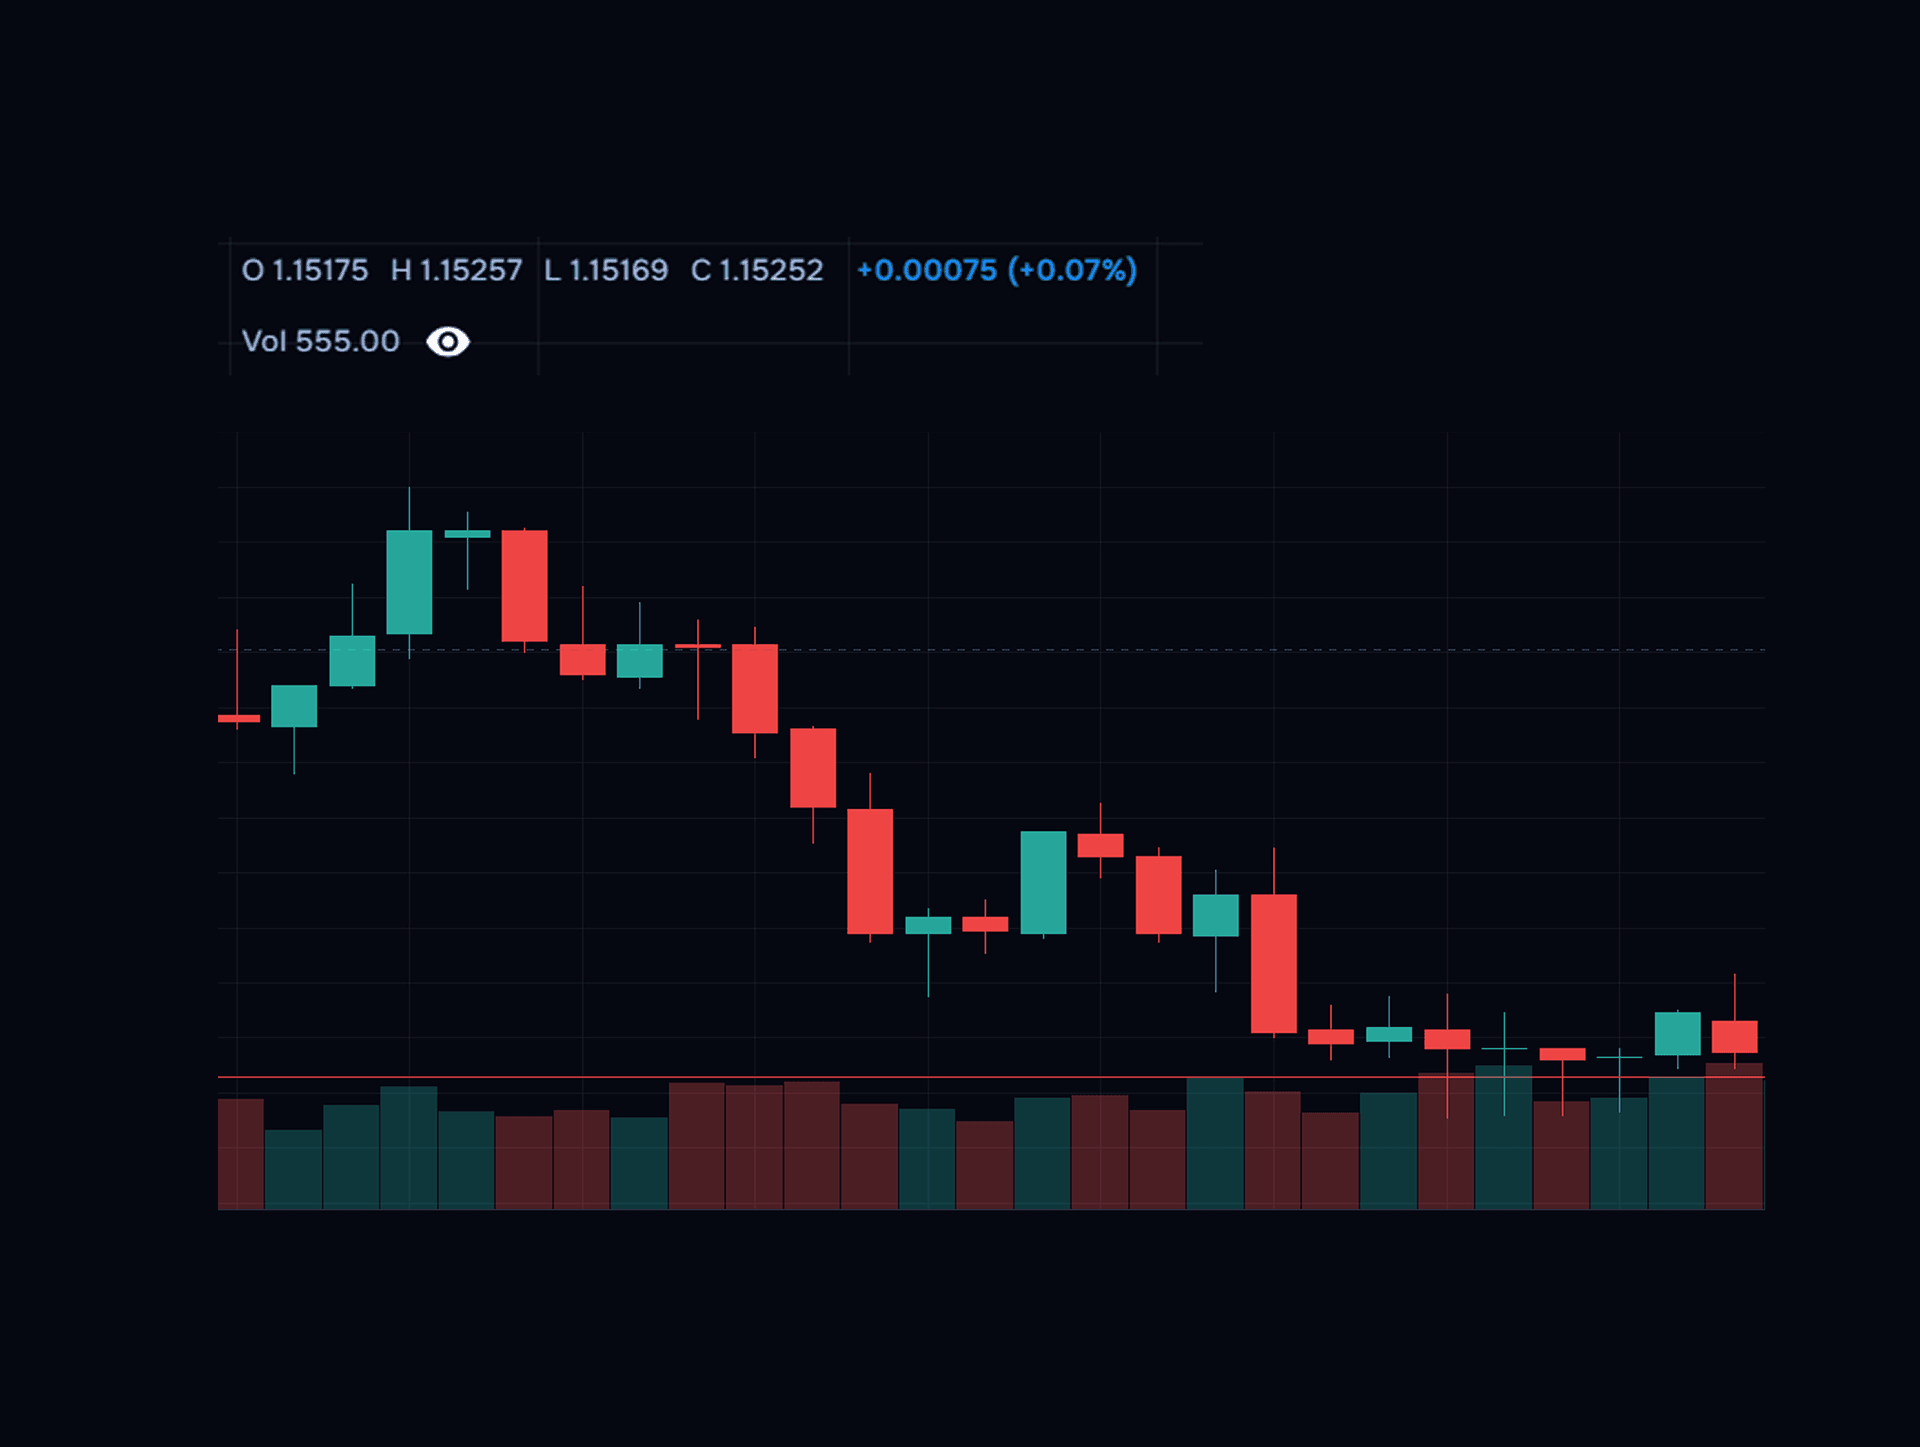
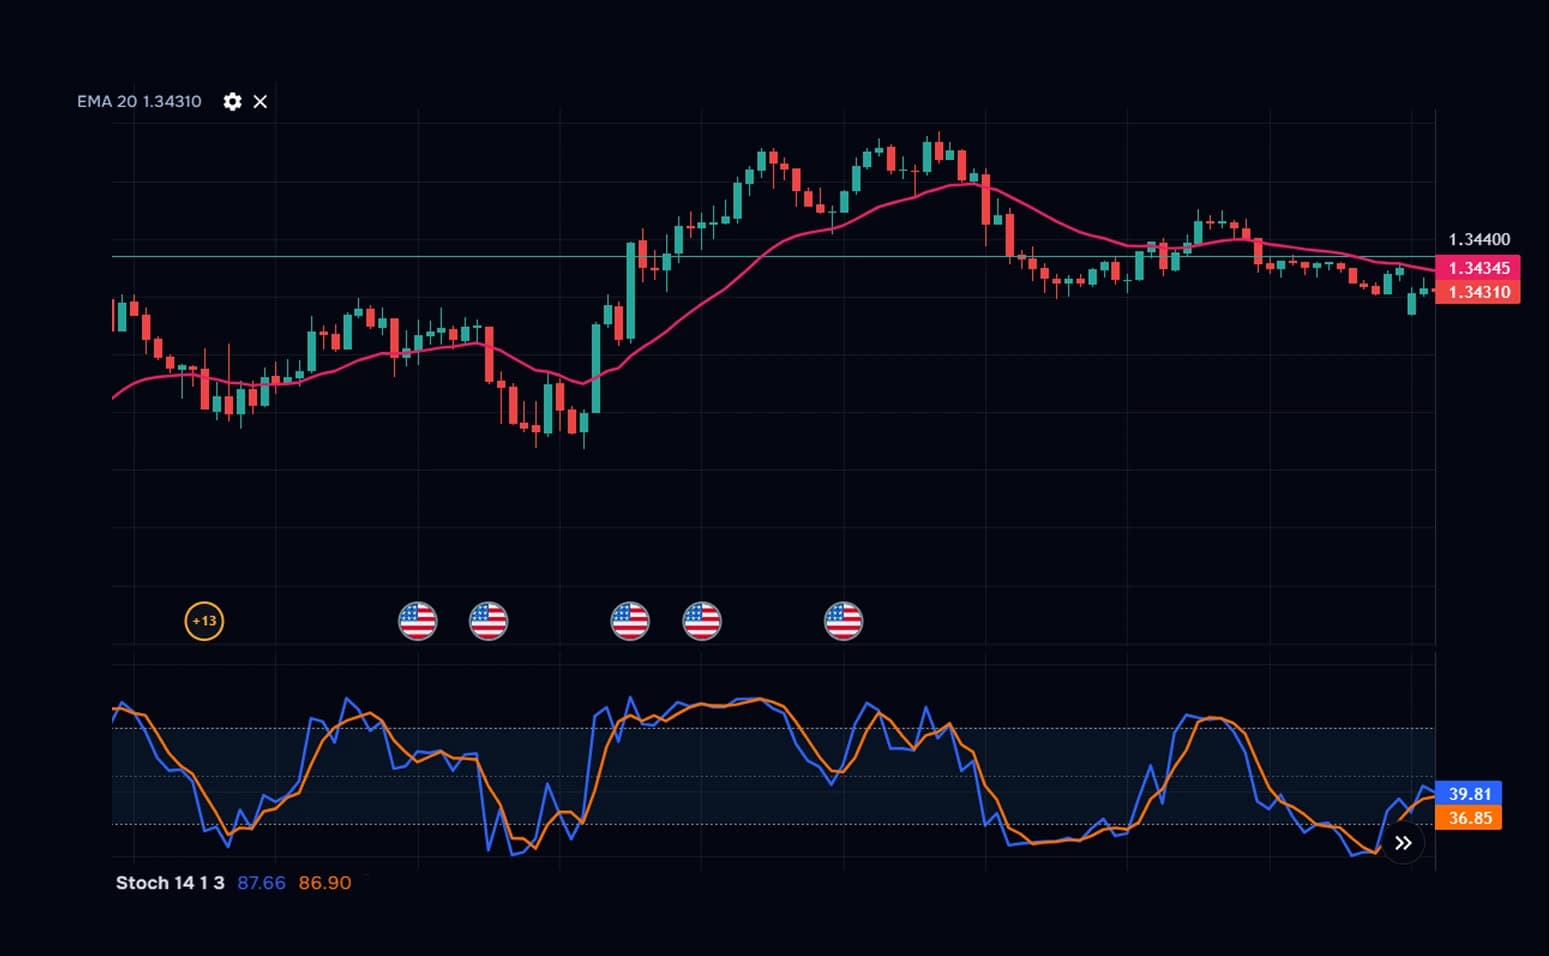
Analyse markets in real time
Track price action with smooth real-time updates, flexible timeframes, and volume data. Keep charts open as a live reference while you trade or explore other markets.
- Stream real-time price data with smooth updates
- Switch between timeframe intervals such as 5m and 1h
- View volume directly on the chart
- Explore markets beyond the symbols you currently trade
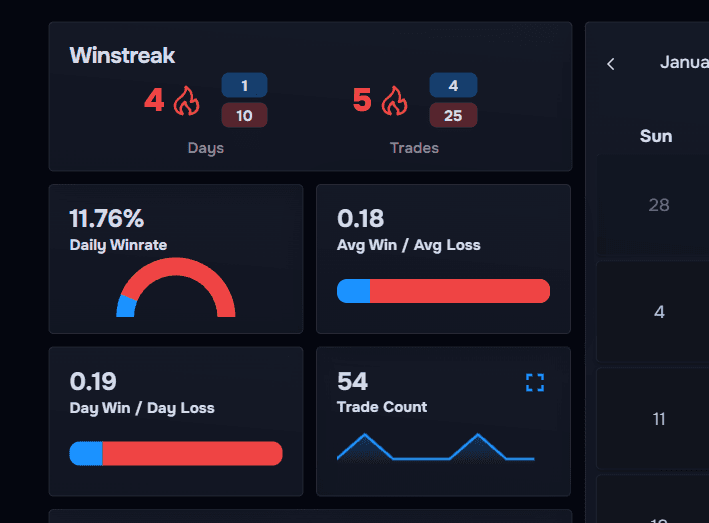
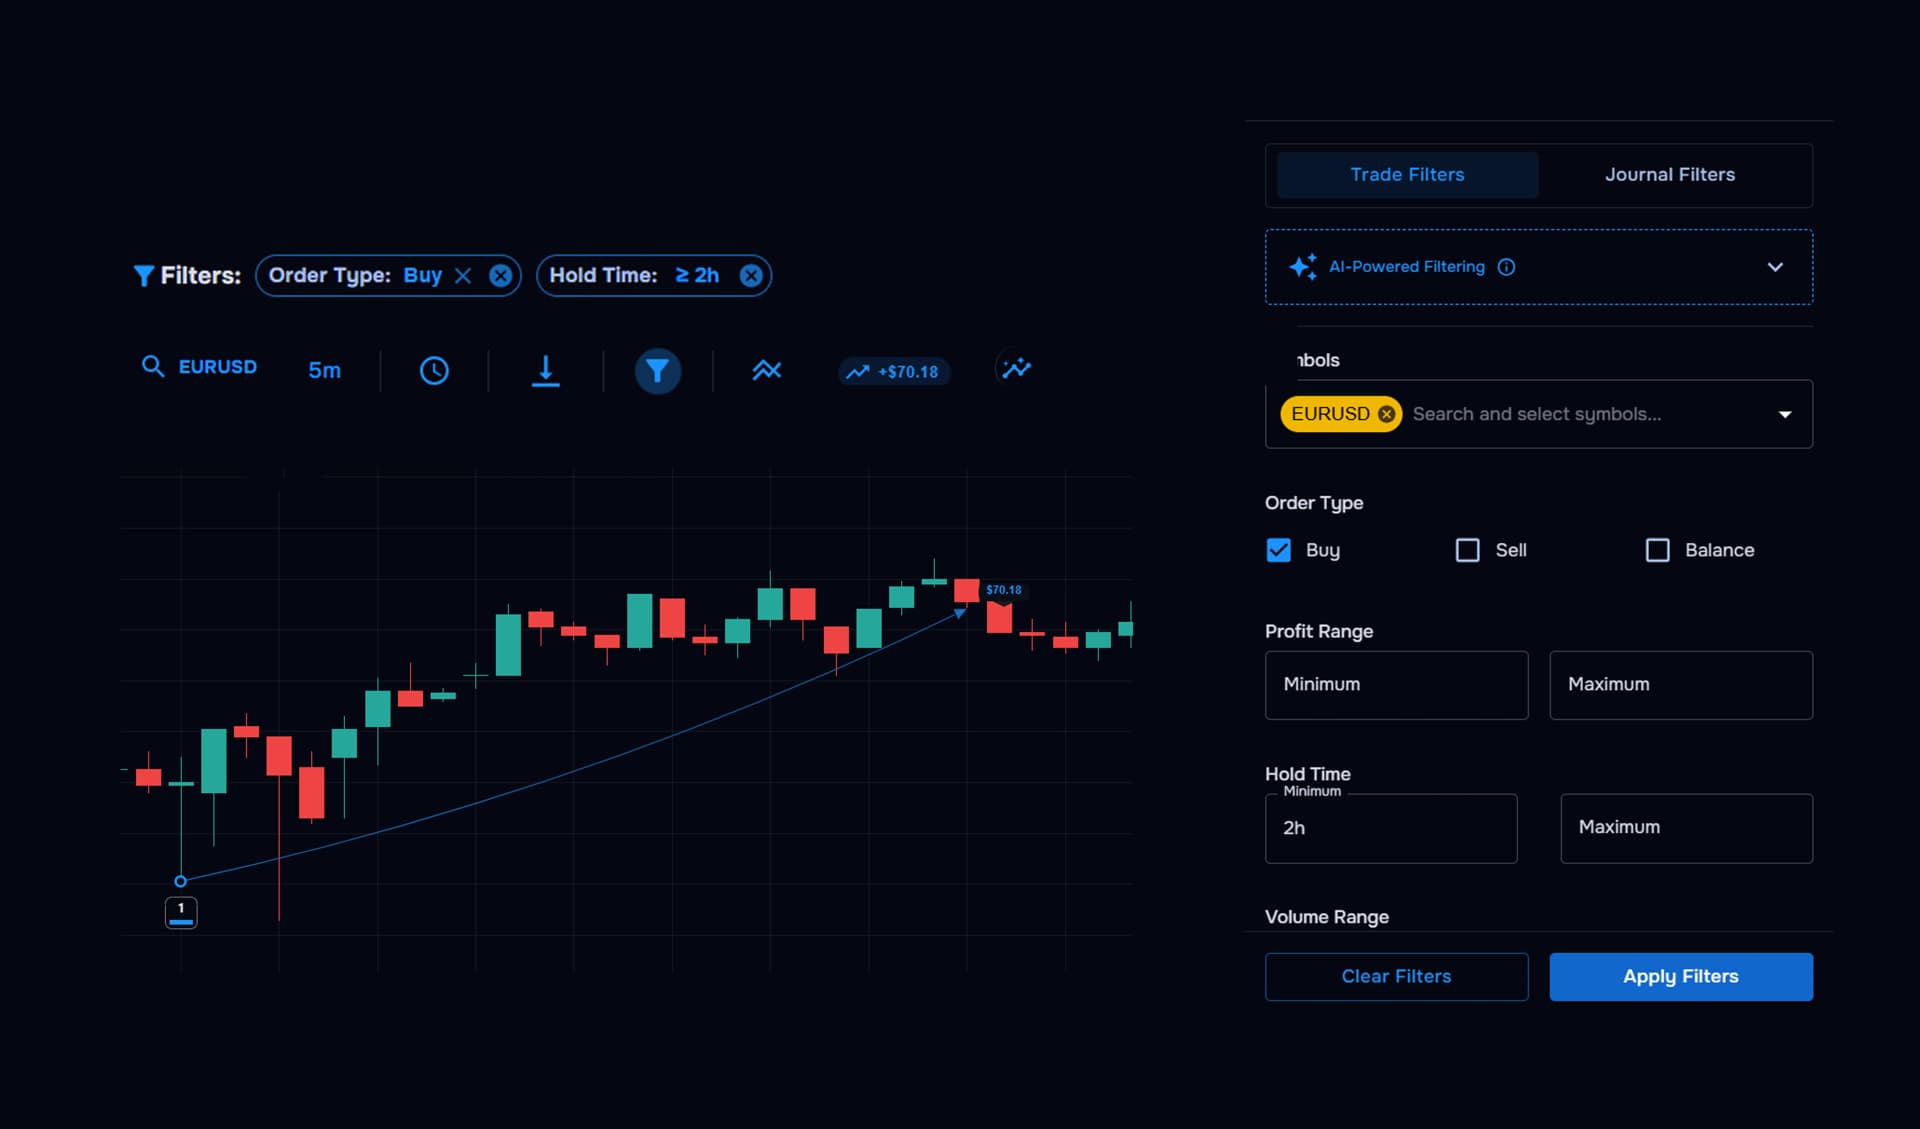
Find patterns in your trades
Break down the trades you see on the chart to uncover patterns faster. Filter by account, symbol, timeframe, and other trade conditions to focus on what matters.
- Filter trades by account, symbol, or timeframe
- Narrow results using trade-specific filters
- Focus on subsets of trades to review behaviour faster
- Spot recurring strengths and weaknesses more easily
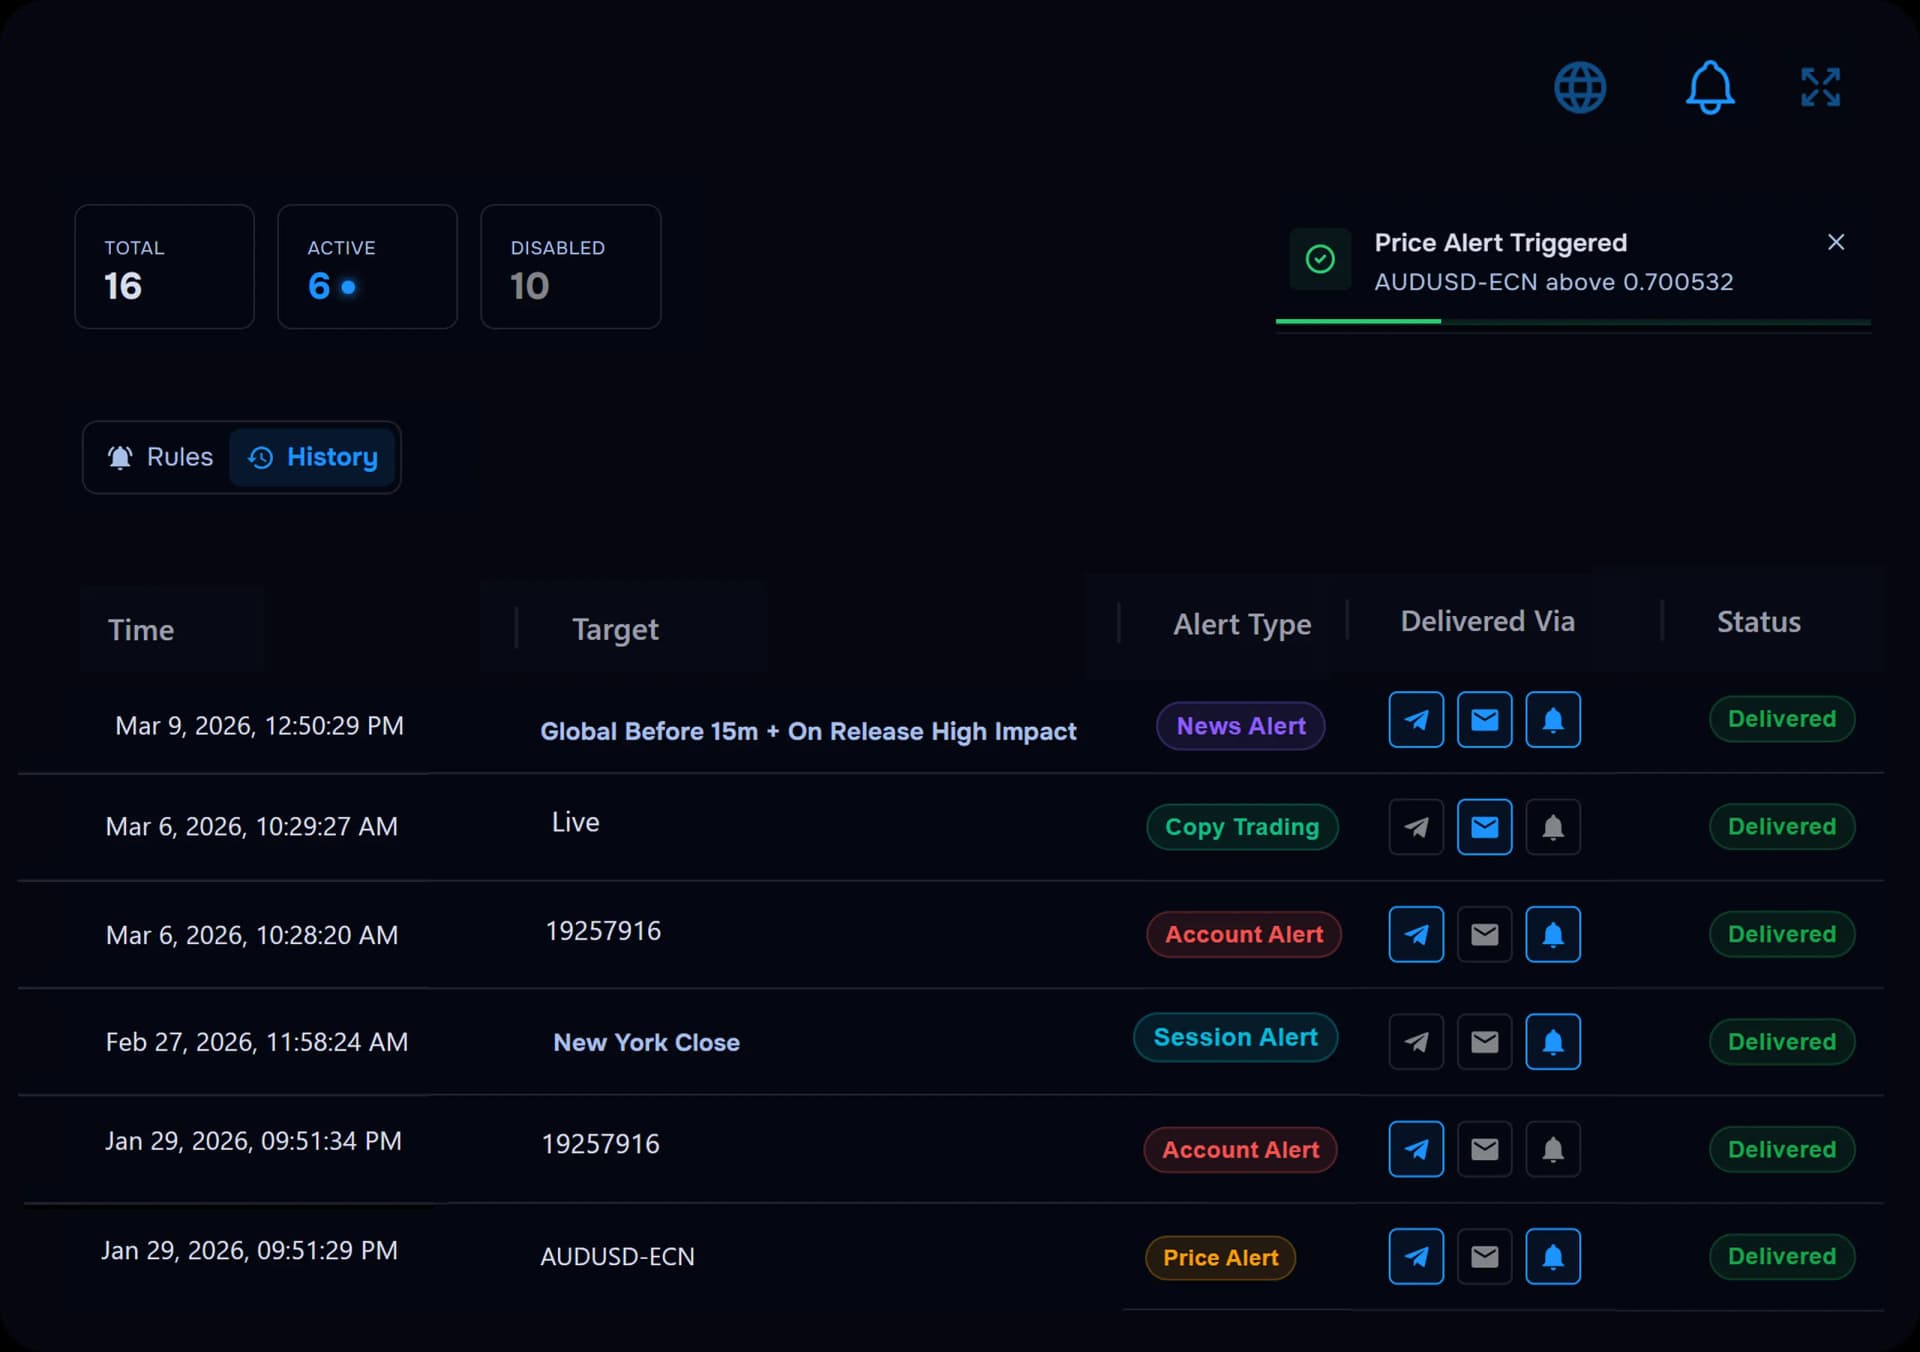
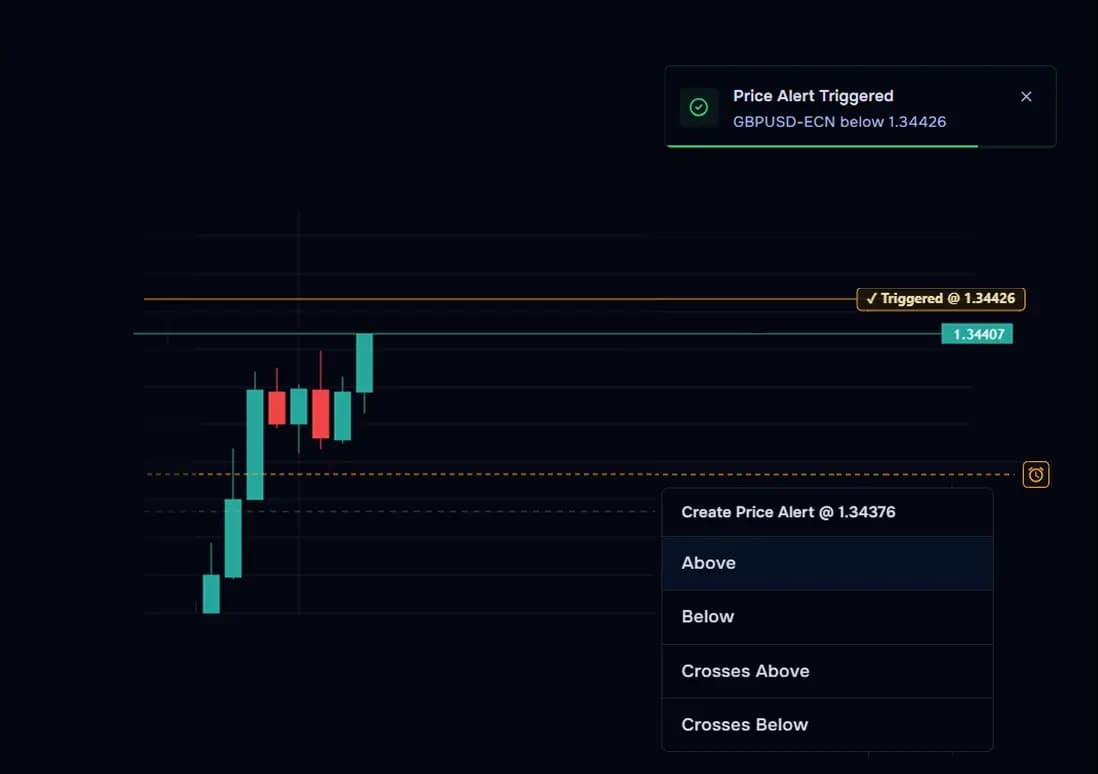
Stay ready without being tied to your screen
Set alerts directly from the chart and stay informed when it matters. Follow price levels and key market changes without needing to stay at your desk.
- Set price alerts directly within the chart
- Stay aware of key levels without constant monitoring
- Use alerts to stay ready while away from your desk
- Respond faster when important moves happen
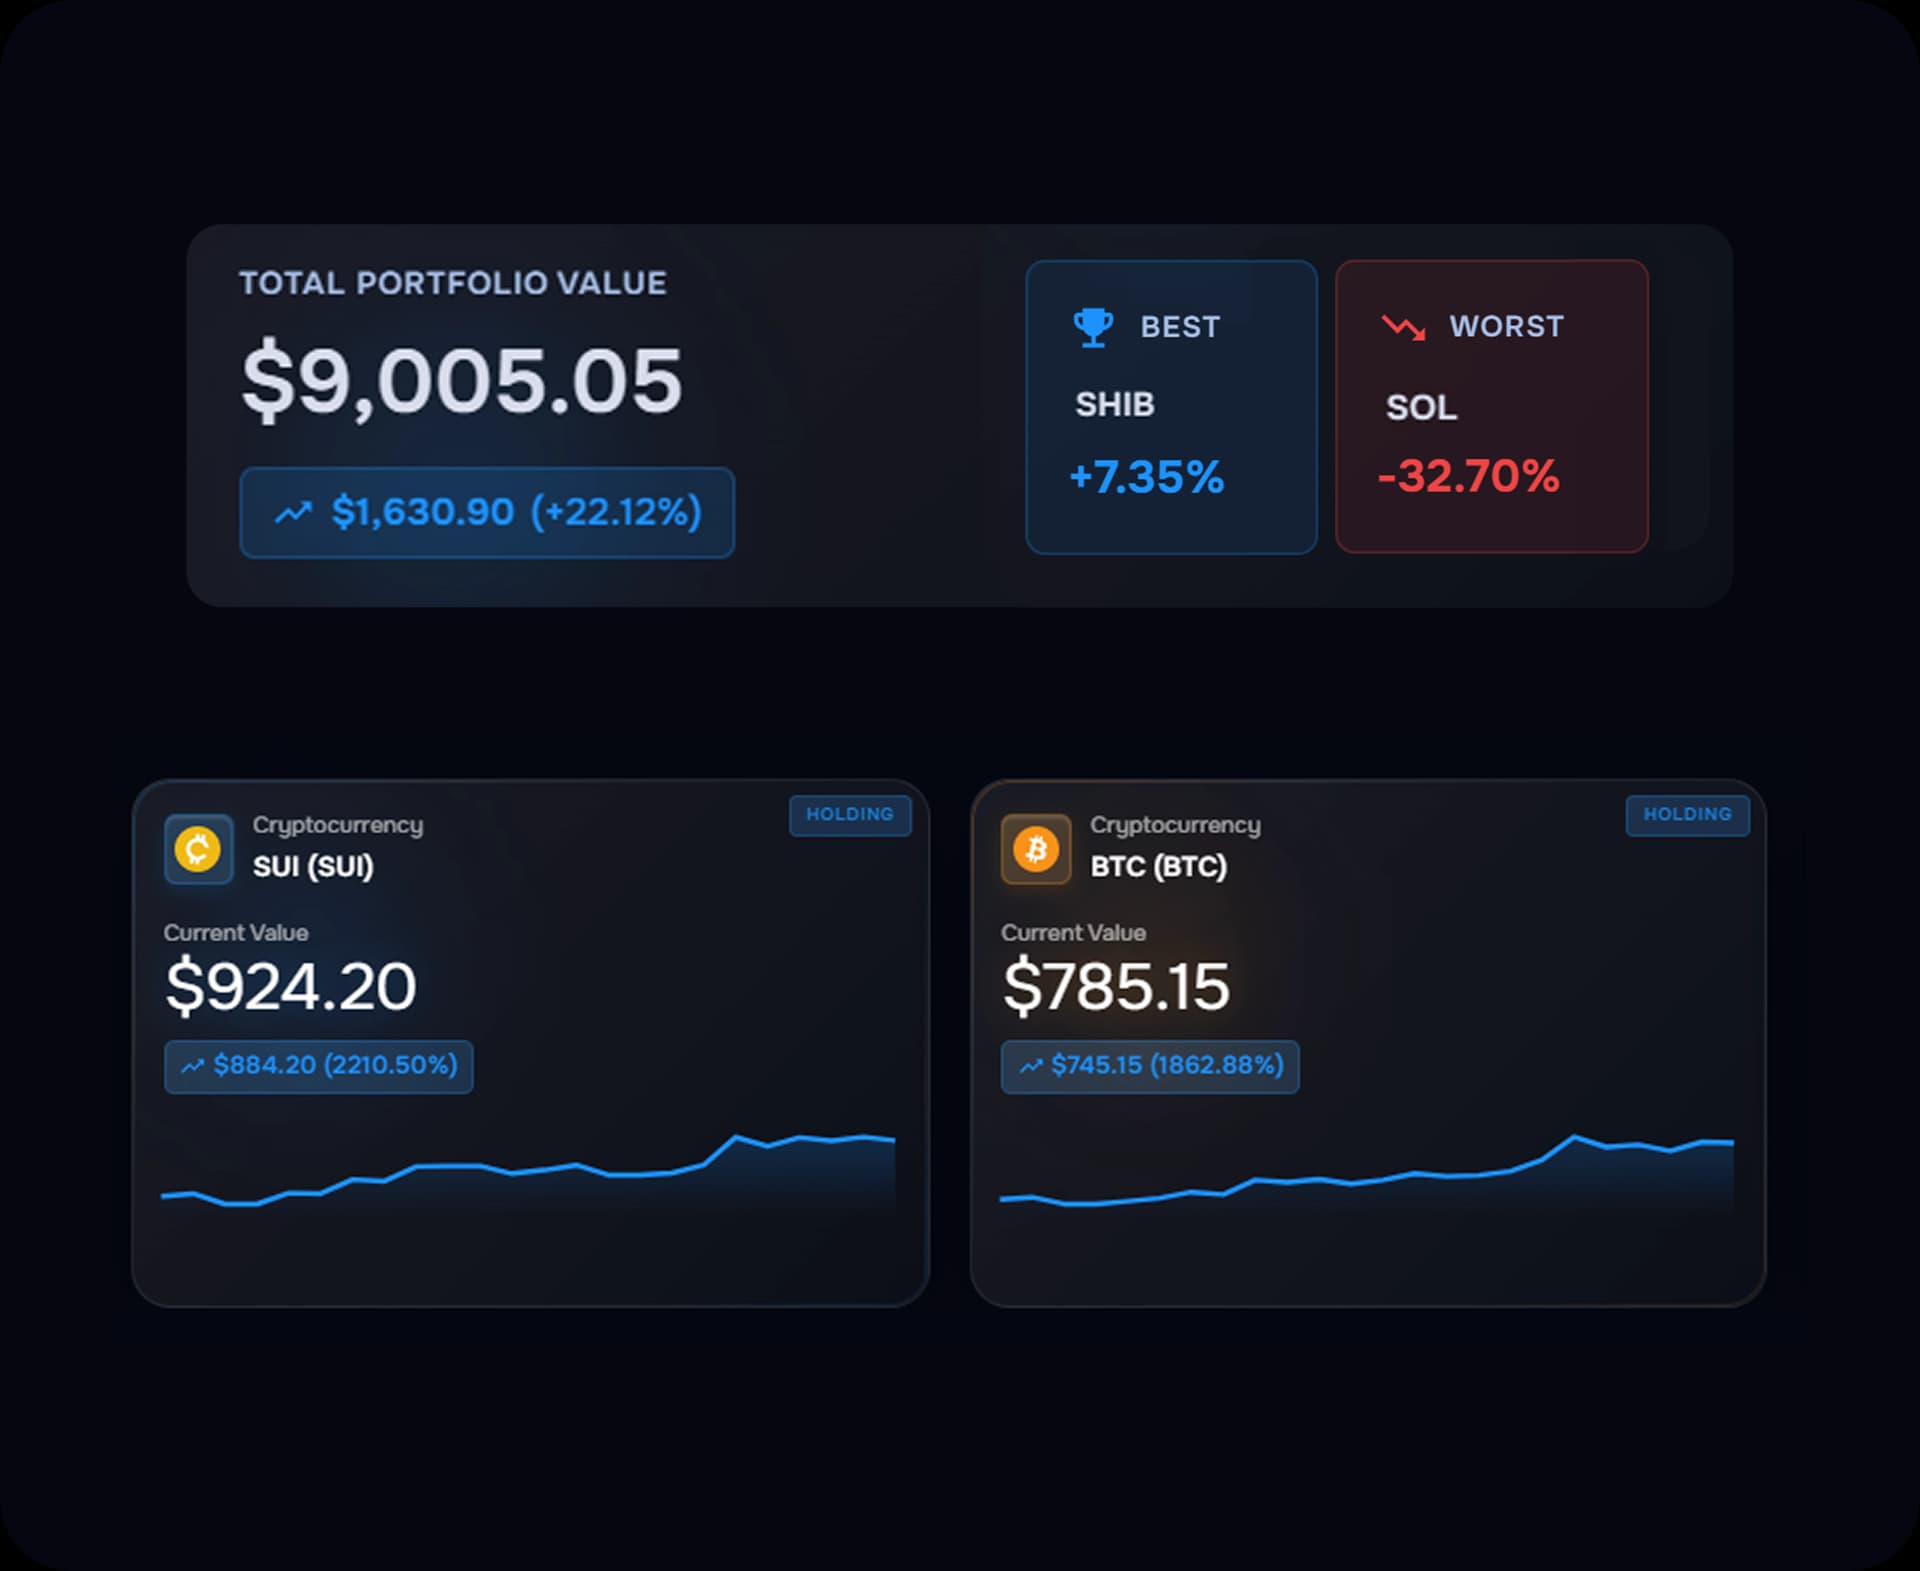
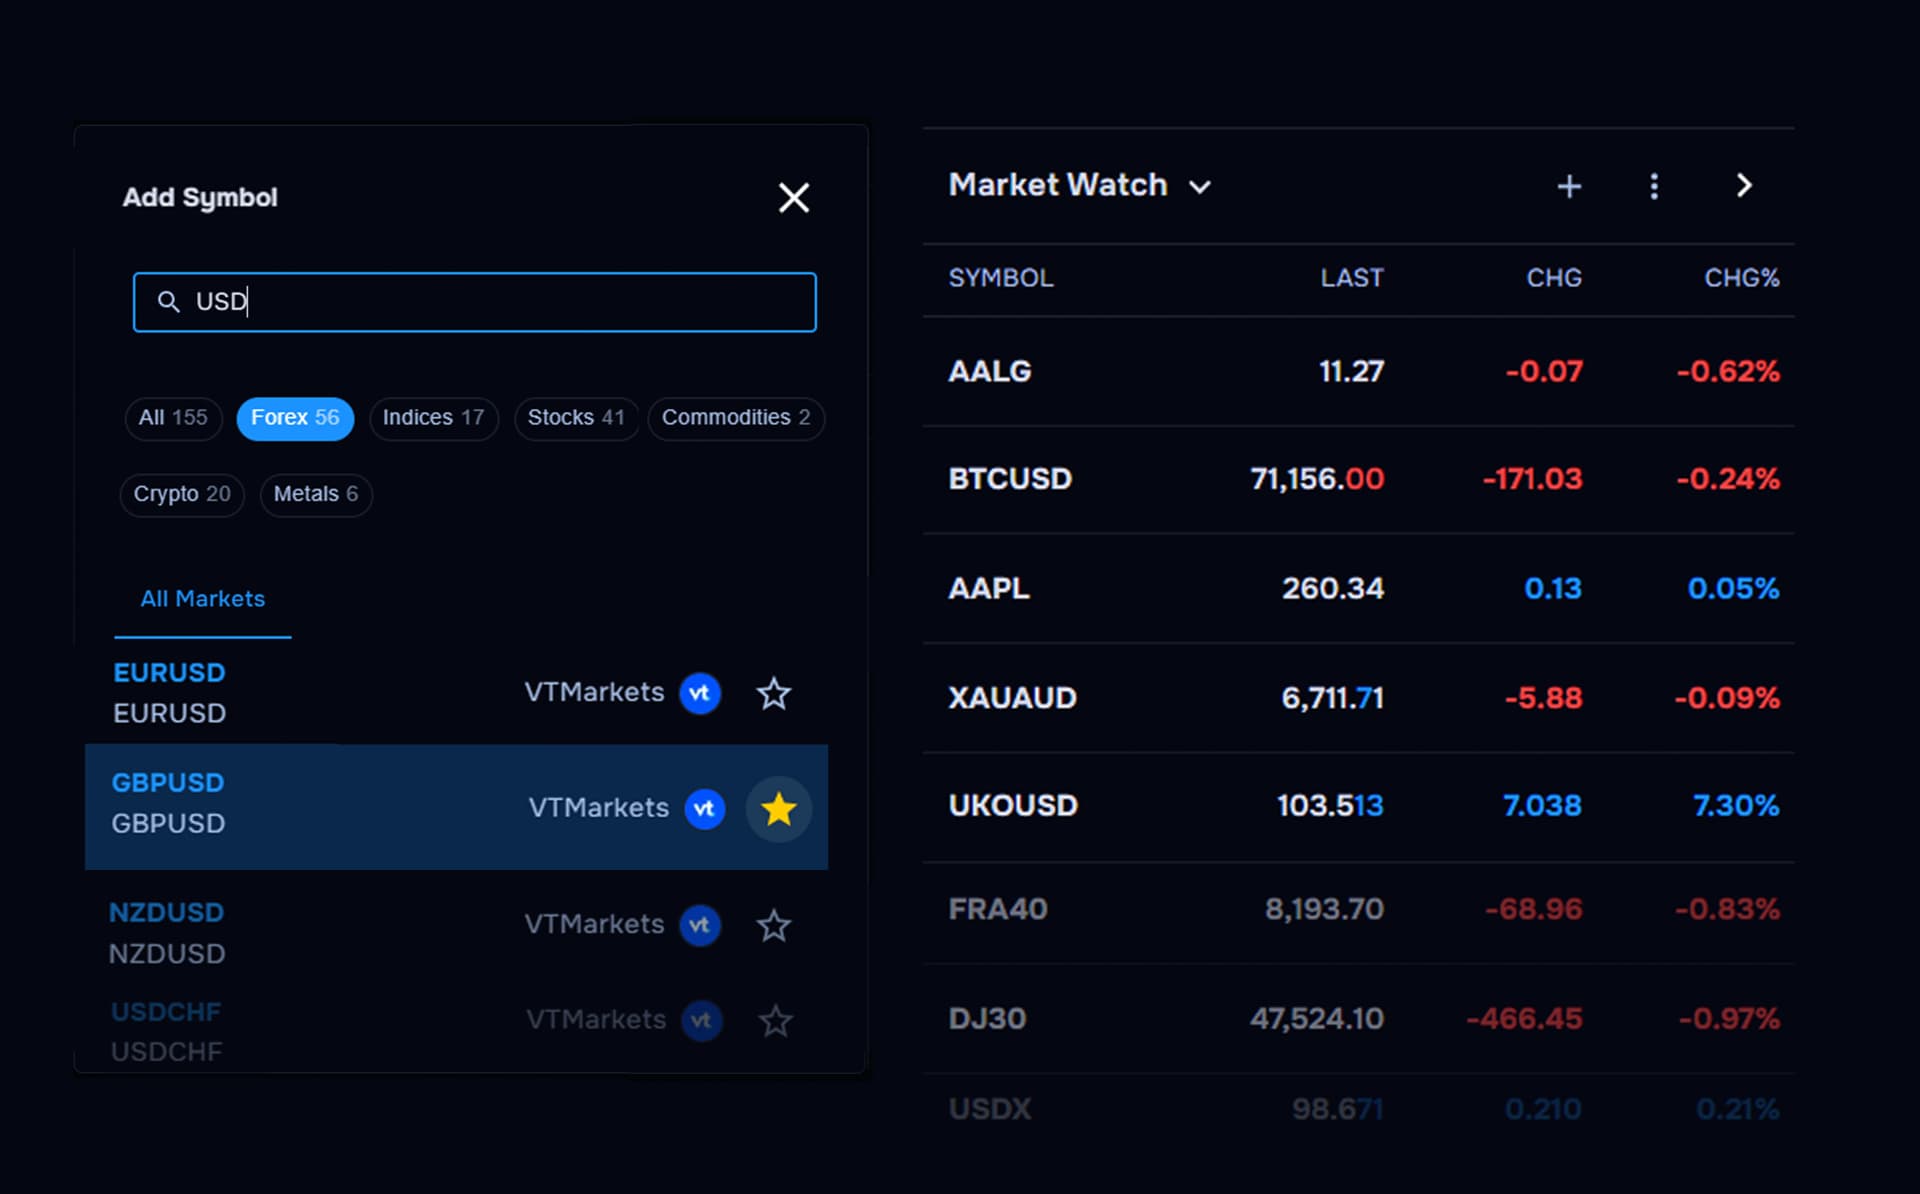
Track opportunities across markets
Keep an eye on symbols from any market, not just the ones you already trade. Use your watchlist to compare setups, monitor ideas, and stay organised.
- Build a watchlist across multiple markets
- Track symbols even when you have no active trade
- Compare setups in one place
- Keep potential opportunities visible and organised
READY TO ANALYSE BETTER?
Stop switching between charts, notes, and tools
Use one complete charting system to follow price, news events, indicators, alerts, and trade journaling in a single workflow.
WHY CONTEXT MATTERS
Event. Reaction. Trade. Insight.
A high-impact release drops. Price expands. Your trade appears on the same chart with event markers, session context, and notes. Instead of guessing afterward, you can see exactly how market structure and timing affected the outcome.