


Smart Money Concepts: What SMC Claims,
and How to Test It on Your Own Trades

Smart money concepts is a vocabulary for describing where price might go and why. This article groups its common claims into four propositions and separates what you can observe from what you can test on your own trades. Whether your version of SMC works depends on the rules you use and the results they produce after costs.

The argument you have already seen
Search this term and you will find two camps shouting past each other.
One says smart money concepts is how markets actually work, that institutions hunt retail stops and leave footprints you can read. The other says it is repackaged support and resistance sold by people whose income comes from courses rather than trading.
There are two questions tangled together here: whether a description of market behaviour is accurate, and whether your implementation of it makes money.
Those are different questions. A pattern can exist without offering a profitable trade, and a profitable setup does not prove the story told about its cause. This article sets out four common SMC claims, explains what would count as evidence against them, and gives you a procedure for reviewing your own implementation.
By the end, you will have something more useful than another opinion: a way to ask better questions of your data.
What SMC is, stated fairly
Smart money concepts is a vocabulary built around one organising idea: large participants need sufficient opposing liquidity to execute large orders, and their execution can affect price.
That does not mean every large order requires price to be pushed toward retail stops. Institutions can spread execution over time and across venues. SMC takes the need for liquidity and builds a chart-reading framework around where that liquidity might be found. 1
From that premise come the terms you will encounter:
| Term | What it points at |
|---|---|
| Liquidity pool | In SMC usage, an area where stop orders are expected to cluster, often beyond obvious highs or lows |
| Order block | Commonly, the last opposing candle before a strong move that meets the trader's qualifying rules |
| Fair value gap | A three-candle pattern with a price zone between the first and third candles' non-overlapping wicks |
| Break of structure | Price breaking a defined prior swing in the trend direction |
| Change of character | A break against the prevailing structure that may signal a shift |
| Premium and discount | The upper and lower halves of a defined range |
A distinction matters here. Market liquidity is broader than stop losses. Resting limit orders provide executable liquidity, while stop orders are conditional and must be triggered before they become executable under their order terms. On CME Globex, for example, stop orders do not immediately enter the order book. A candle chart also does not confirm that stops are sitting beyond a particular high. 2
SMC and ICT are not quite the same thing. ICT refers to the specific body of material taught by the Inner Circle Trader. SMC is the broader label used by many traders and educators for an overlapping collection of concepts. The terminology overlaps heavily, but the rules and interpretations can vary between educators.
The four SMC claims
For this article, we group common SMC claims into four propositions. This is a framework for examining the ideas, rather than an official definition every SMC trader follows.
Keep three questions separate as you read: does the behaviour occur, what causes it, and can your rules profit from it? Your journal is most useful for the third. The first may require a broader record of chart events, including setups you did not trade. The second often needs evidence a candle chart cannot provide.
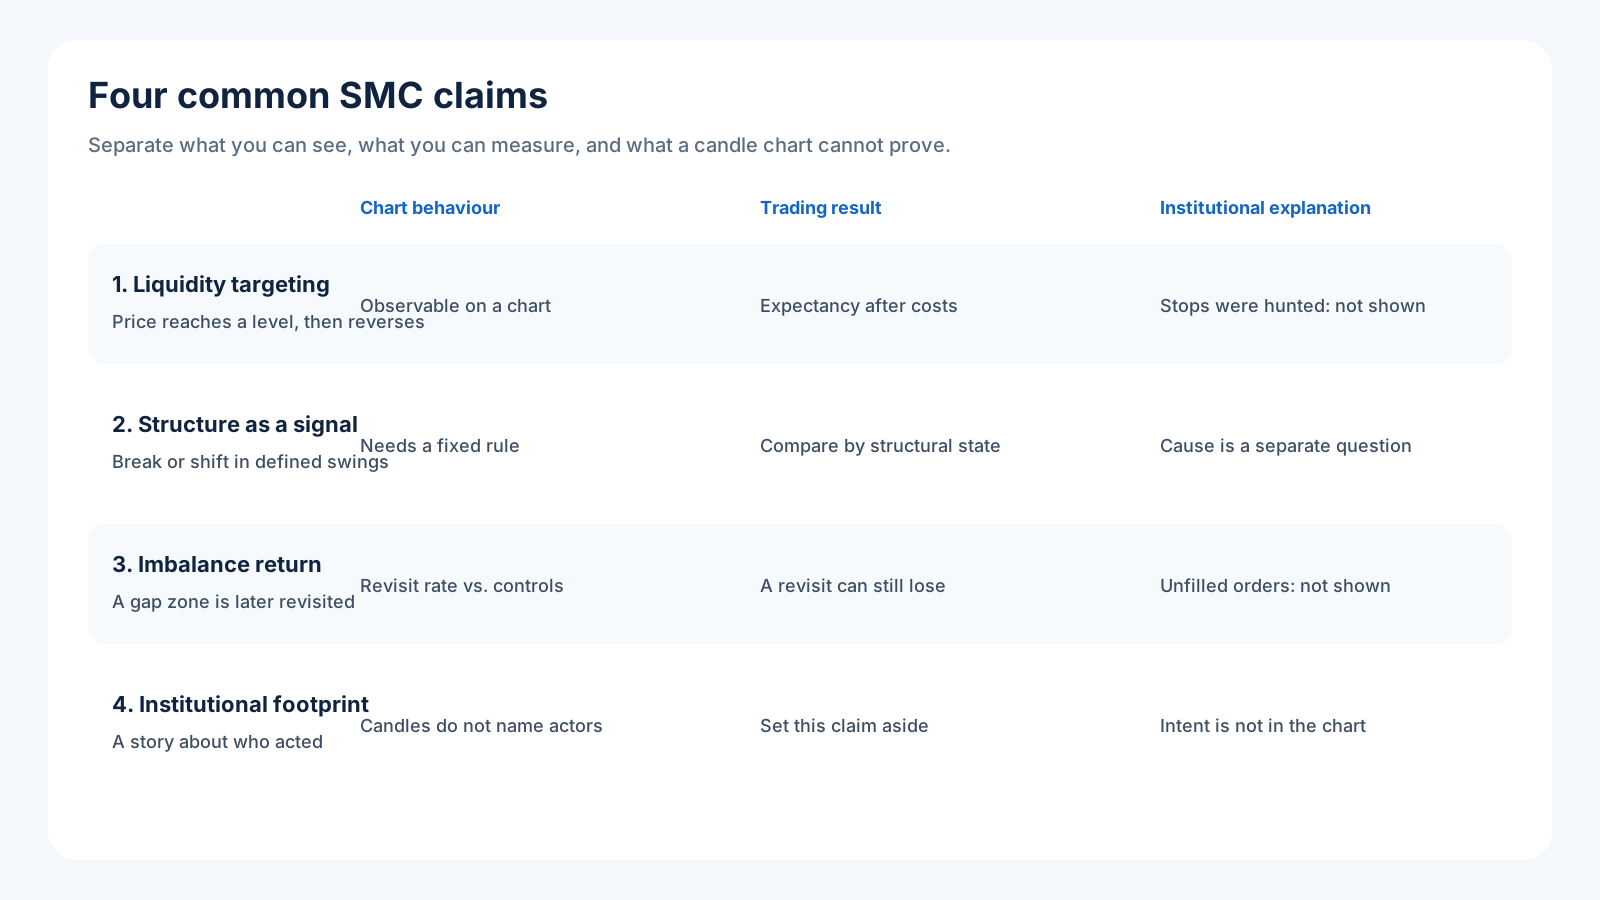
Four common SMC claims, with chart behaviour, trading performance and institutional explanations distinguished.
Claim 1: liquidity targeting
The claim: price tends to move toward areas where stop orders are expected to cluster, and often reverses after reaching them. When price pushes through a watched level and then returns inside, traders often call that a liquidity sweep.
What would count against it: clearly defined levels showing no greater tendency to be reached, or followed by reversals, than comparable control levels within a fixed window. The comparison needs to account for factors such as distance from price, volatility and market conditions.
How you review your implementation: tag trades by whether a predefined liquidity level was swept beforehand. Compare expectancy after costs against a relevant baseline. Expectancy is the average result per trade in the sample. This article measures results in R, where 1R is a gain or loss equal to the amount initially risked. If the sweep group performs poorly, that counts against your sweep setup. It does not establish whether stops were present or why price moved.
Claim 2: structure as a signal
The claim: a break of structure favours continuation, while a change of character may signal that the prevailing direction is weakening or changing.
What would count against it: defined structural signals failing to predict subsequent continuation or reversal better than an appropriate baseline over a sufficient sample.
How you review your implementation: tag every trade with the structural state at entry. Compare win rate, average win, average loss and expectancy by state. Define which swings count and whether a break requires a wick or a close. Otherwise, the signal can change depending on who is drawing it.
Claim 3: imbalance return
The claim: price tends to revisit fair value gaps. A common SMC explanation is that orders were left unfilled during the original move.
The pattern and the explanation are separate. A fair value gap does not mean no trading occurred inside that price zone. Price may have traded through it during the middle candle, and the pattern alone does not establish that unfilled orders remain there. 3
What would count against the revisit claim: predefined gaps being revisited no more frequently than comparable control ranges, matched for factors such as width and distance from price, within a fixed window.
How you test it: record all qualifying gaps in your sample, including those you do not trade. Define whether a revisit means a first touch, a midpoint touch or a full fill. Then measure the revisit rate. Separately, measure the expectancy of your FVG trades. A high revisit rate can coexist with a losing trading strategy.
Claim 4: institutional footprint
The claim: institutions create these patterns, leaving evidence of their activity and intentions on the chart.
What would count against it: evidence linking the patterns to other causes, or showing that the proposed institutional explanation fails under a clearly specified test. But a candle chart alone cannot establish who created a pattern or why.
This fourth claim is the one to set aside when reviewing your chart setups. More detailed transaction and order-book data can reveal activity that candles hide, but even order-level data can be anonymous. CME's Market by Order feed, for example, does not identify customers. Seeing a large order is not the same as knowing its owner's intent. 4
Stated as one line: you can investigate the price behaviours SMC describes and measure the results of your own trading rules without treating institutional intent as an established fact.
Dropping that assumption costs you nothing when testing entries. Your rules still have to earn their place through their results.
Is it just support and resistance?
The most common criticism, and it deserves a straight answer: partly, yes.
An order block can be used as a specific way of defining a potential support or resistance zone. A liquidity sweep overlaps with the familiar idea of a false breakout. Neither phenomenon needs an institutional story to be observable.
What matters for measurement is precision of definition. "Support" can be a vaguely drawn region, but it can also be a level defined by a consistent rule. The same is true of an order block. "The last opposing candle before displacement" still leaves questions about what counts as displacement, which candle qualifies and where the zone begins and ends.
Traditional support and resistance have also been tested empirically. A New York Fed study published in 2000 examined levels supplied by six foreign-exchange firms. SMC did not make this kind of measurement possible for the first time. 5
So the fair summary: SMC gives traders another vocabulary for familiar chart behaviours. Whether it makes your decisions clearer depends on how tightly you define the rules. Whether that clarity pays for the extra complexity is a question about your data.
Why SMC traders can still lose
Worth addressing, because knowing the terminology does not solve the trading problem.
The vocabulary is large and the strategy can be absent. Learning twenty terms feels like progress. But a concept identifies something to watch. A strategy still needs entry, exit, risk and invalidation rules. A trader who has learned twenty concepts and specified none of those rules has vocabulary, not a strategy.
Everything looks clearer in hindsight. A chart can be annotated with order blocks and liquidity grabs after the fact, and the annotation can look convincing. Identifying a setup before its outcome is known is a different task. That can happen before the session or while the session develops, but the rules need to be usable with the information available at the time.
Concepts get blended. A trader tags "SMC" on an order block trade, a sweep trade and a fair value gap trade. The combined average can hide meaningful differences. One setup may have positive expectancy while another cancels it out, and the blended tag makes that harder to see.
That third point is the one you can fix today, and it is what the next section is for.
How to test SMC on your own trades
Separate the concepts, keep the rules stable and treat the first results as a starting point.
Step 1: tag by concept, not by “SMC”
In your trading journal, give each concept its own tag:
smc-sweepfor liquidity sweep entriessmc-obfor order block entriessmc-fvgfor fair value gap entriessmc-bosfor break of structure continuation entriessmc-chochfor change of character reversal entries
Add a second tag for structural context: struct-aligned or struct-against. This gives you another comparison to investigate rather than assuming that alignment improves every setup.
If a trade uses several concepts, decide in advance how you will record that overlap. The same trade appearing in two groups does not become two independent observations.
You can keep this record in a spreadsheet or a journal with custom tagging, such as TraderWaves Pro.
Step 2: start with 30 trades per setup, without changing the rules
Per setup, not in total. Thirty trades spread across five setups is six each, and six trades gives you very little evidence about a strategy's expectancy.
Thirty is a practical checkpoint, not a threshold that proves an edge. The sample needed for a reliable conclusion depends on how variable the outcomes are and how small an advantage you are trying to detect. Statistical sample-size guidance explicitly accounts for the effect being tested and the confidence required. 6
If that means a longer sample window, take the longer window. Record the market, timeframe and session so you know what the results actually cover. A month in one market condition is not evidence that the setup works in every condition.
Changing your rules creates a new version of the setup. Keep the old results, but analyse the new version separately.
Step 3: run the comparisons
| Question | Measurement | What the result means |
|---|---|---|
| Are sweep entries useful in my plan? | Expectancy after costs on smc-sweep trades against comparable trades without that condition | A difference may justify further testing, but does not establish why price swept the level |
| Does structural alignment help my execution? | Expectancy, win rate and average win/loss on struct-aligned against struct-against | Compare similar setups and conditions before attributing a difference to structure |
| Do marked FVGs get revisited, and can I trade them profitably? | Revisit rate across all qualifying gaps, plus expectancy after costs on traded setups | Revisit frequency and trading profitability answer different questions |
Include commissions, spread and slippage where relevant, along with financing costs if they apply. Compare returns in consistent units, such as R-multiples based on the initial risk, so changes in position size do not obscure the comparison.
A group beating your overall average is not automatically profitable. If your baseline loses 0.5R per trade and the setup loses 0.2R, it is better than the baseline and still losing money.
To study historical setups faster than live trading allows, the backtester replays historical sessions. Keep a separate test log where needed, use information available at each entry, and avoid selecting only the examples that look clean in hindsight.
Step 4: apply one decision rule
Do not keep or remove a setup based on win rate alone.
A setup winning 30% of trades with an average gain of 3R and an average loss of 1R has an expectancy of 0.2R per trade before costs. A setup winning 60% with an average gain of 0.5R and an average loss of 1R has an expectancy of minus 0.1R before costs. The higher win rate is attached to the losing strategy. CME's explanation of mathematical expectation makes the same distinction between winning frequently and making money on average. 7
Review expectancy after costs, the size and concentration of losses, and whether one unusual winner is carrying the result. An uncertain result is a reason to gather more evidence rather than force a verdict.
If you remove filters or select the strongest setup after studying the results, check that revised plan on a fresh period of data. Using the same sample to choose the rules and declare them successful can make chance look like an edge.
You may find that one or two setups deserve more attention while the rest need clearer rules or have not shown enough evidence to justify keeping them. That is a useful finding, even when the answer is "not enough data yet."
Sources
- Bank for International Settlements: The global foreign exchange market in a higher-volatility environment. Discusses spreading large orders over time and across venues using execution algorithms.
- CME Group: Futures Order Types. Explains limit, market and conditional stop orders.
- TrendSpider: Fair Value Gap Basics. Used for the three-candle pattern definition and indicator criteria, rather than as evidence of the pattern's cause or profitability.
- CME Group: Market by Order. Describes order-level market data and customer anonymity.
- Federal Reserve Bank of New York: Support for Resistance, Technical Analysis and Intraday Exchange Rates. An empirical study of published support and resistance levels.
- NIST: Sample Sizes Required. Explains how sample requirements depend on the effect, significance level and statistical power.
- CME Group: The Mathematics of Trading Success. Explains mathematical expectation and why win frequency alone does not determine profitability.
Put it against your own data
The SMC argument has run for years and will keep running, partly because people mix up a description, an explanation and a trading result.
You do not have to settle every part of it before reviewing your own trades. Tag concepts separately, define the rules and measure expectancy after costs. Start with a manageable sample, then check whether the findings survive more data and a fresh test.
Whatever the answer is for your setup, it will give you something more useful to work with than another argument in the thread.
Start free with TraderWaves for unlimited journaling and supported broker connections across 700+ compatible brokers and exchanges. No credit card, free permanently. For custom tags and backtesting, explore TraderWaves Pro.
Educational content only. This article is for educational purposes and is not financial advice, a recommendation, or an offer to trade. Trading carries risk of loss. TraderWaves is operated by Wallace FX Ltd, London, United Kingdom.
Is the smart money concept real?
The price behaviours SMC describes are observable: price can trade through obvious levels and reverse, and it can revisit fair value gap zones. Whether those events occur more often than an appropriate baseline is a separate question. The claim that institutions deliberately create a particular pattern cannot be established from the candle chart alone.
What is the difference between ICT and SMC?
ICT refers to the specific body of teaching from the Inner Circle Trader. SMC is a broader label used by multiple sources for an overlapping collection of concepts. The terminology overlaps heavily, but the rules and interpretations can vary between educators.
Does smart money concepts actually work?
SMC is not one fixed strategy, so there is no single result that applies to every version. The useful question is whether a clearly defined setup has positive expectancy after costs, and whether that result persists on fresh data. Thirty tagged trades can start the review, but cannot guarantee a reliable answer or future profitability.
Is SMC just support and resistance with new names?
Partly. Several SMC concepts overlap with familiar ideas such as support, resistance and false breakouts. Either vocabulary can support a testable method if the rules are explicit. Neither becomes precise just because the labels sound more technical.
Can beginners learn smart money concepts?
The vocabulary is learnable, but turning it into a strategy takes more than recognising chart patterns. Entry rules, invalidation, risk and exits still need to be specified. Start with one setup you can define consistently rather than trying to trade every concept at once.
Ready to journal?
Start Tracking Your Trades Today
Sign up now and access advanced trade journaling tools for free.
Start Free: No Credit Card