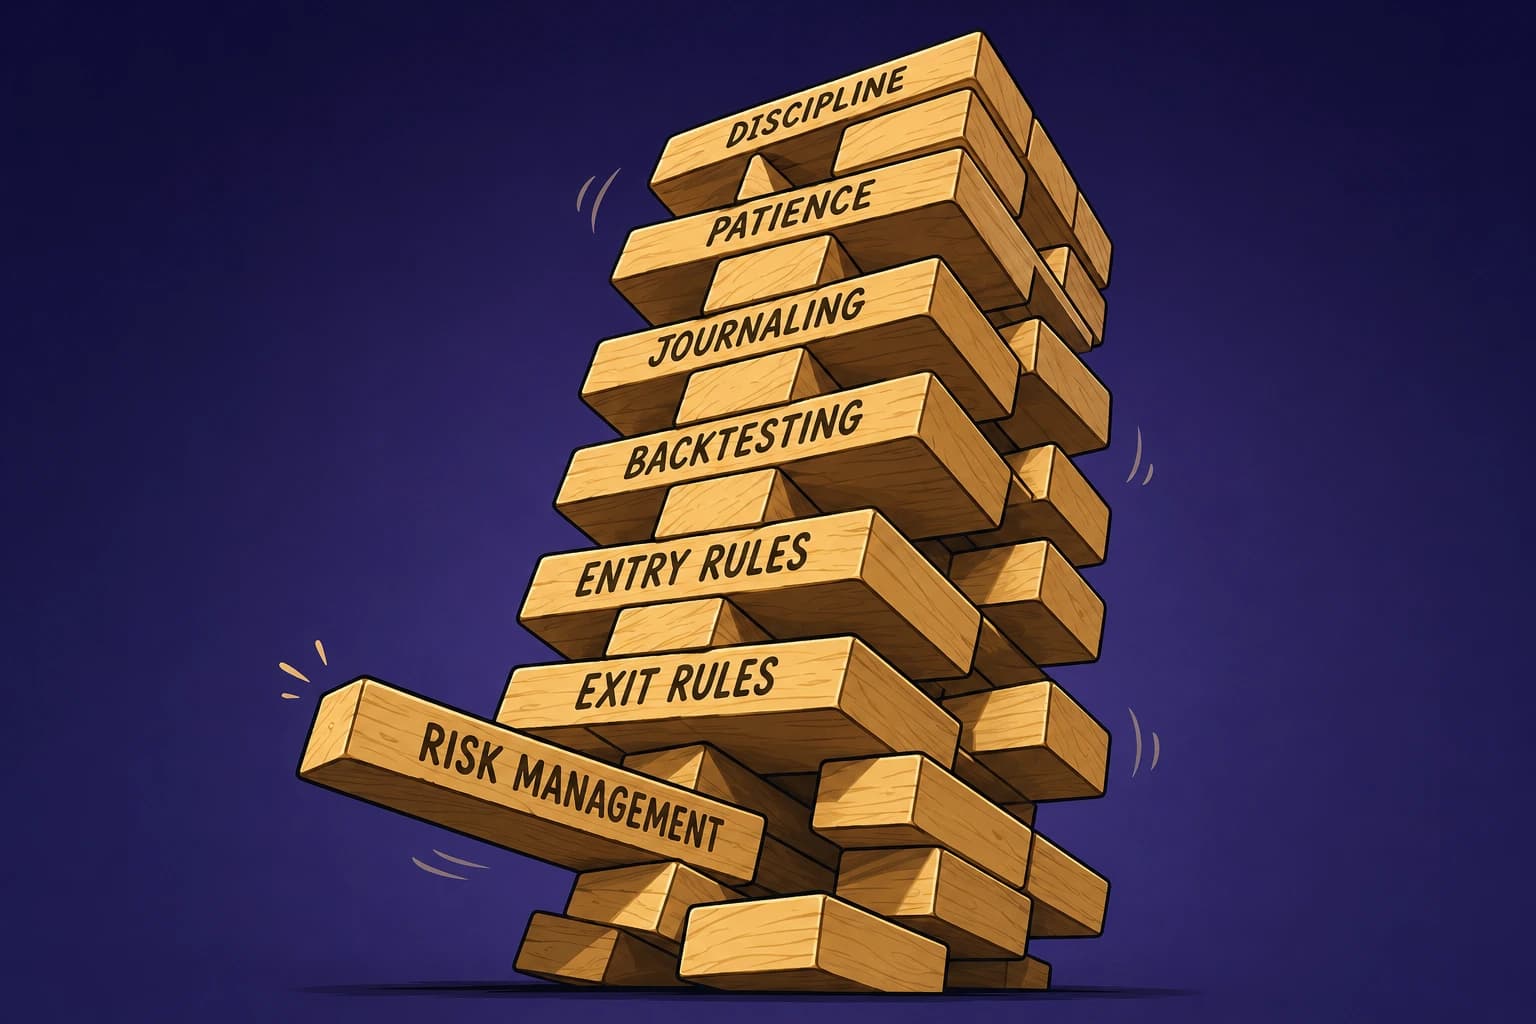
How to Spot Risk Problems Before They Become Expensive
Most trading risk problems do not begin with one catastrophic loss. They usually build through smaller decisions: taking too much risk on individual trades, concentrating several positions around the same market move, or repeatedly departing from a trading plan.
Reviewing recent trades can show whether damage came from position size, drawdown, concentration or execution. The same findings also help you set clearer limits before the next trade is open. The goal is not to rewrite the strategy at the first sign of trouble. It is to identify the source of risk, fix that source and stop the same exposure from repeating.
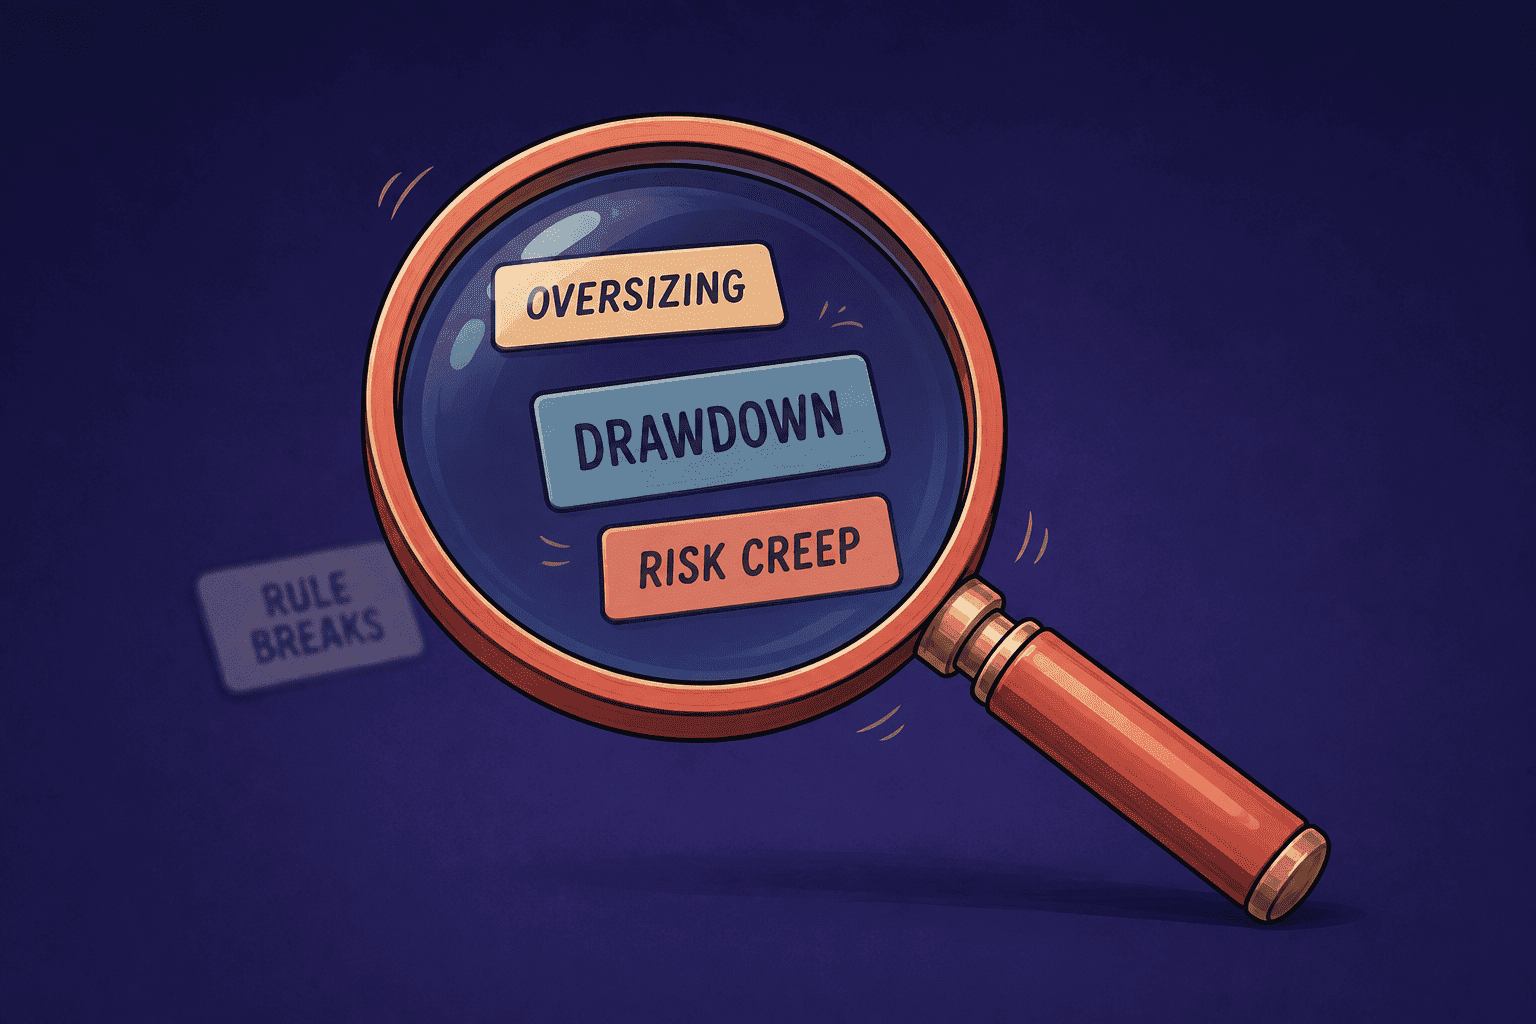
Start With Position Size and Risk Per Trade
Position sizing is one of the most direct ways to control trading risk. Planned risk per trade is the estimated loss if the position exits at the intended stop. Position size is how that planned cash risk is turned into lots, shares or contracts.
Hitting the intended stop does not guarantee that exact cash loss. Slippage, market gaps, spreads, commissions, fees or execution delays can make the actual loss larger. Planned risk is still useful for deciding size in advance, but it remains an estimate rather than a hard ceiling.
Position sizing formulas
Planned cash risk = account equity × chosen risk percentage
Position size = planned cash risk ÷ risk per unit
Risk per unit is based on the distance between the entry and intended stop, adjusted for the instrument’s value per point, pip, tick or share. The result is an estimate. Transaction costs or slippage may increase the actual loss. There is no universal risk percentage that suits every trader, market or strategy.
Two traders can take the same setup and get very different account outcomes if they attach different capital to each loss. A strategy can behave as expected and still produce an uncomfortable drawdown if planned risk is too large for the account. That is the core idea behind The Fastest Way to Blow Up a Good Trading Strategy.
Inconsistent sizing also makes strategy evaluation harder. If some trades are taken at normal size and others are doubled after a win streak, a period of confidence or a losing trade, you are no longer reviewing one process. You are reviewing the strategy plus a changing risk model.
Example
Imagine a trader usually plans £40 of risk per trade. After three consecutive losses, they increase the next trade to £80 to recover more quickly. That next trade loses as well. The original three losses were uncomfortable. The fourth loss turns a normal losing streak into a much deeper hit, even though the setup itself may not have changed.
Review recent trades for periods where planned risk or position size changed significantly, especially after losses or during periods of high confidence. Check whether the largest losses also came from the largest positions. One oversized trade does not prove a lasting habit, so look for repetition before rewriting the setup.
Key takeaway: Position size determines how much of the account is exposed when a trade goes wrong, and planned risk is an estimate rather than a guaranteed maximum loss.
Look at Drawdown and Risk-Adjusted Performance
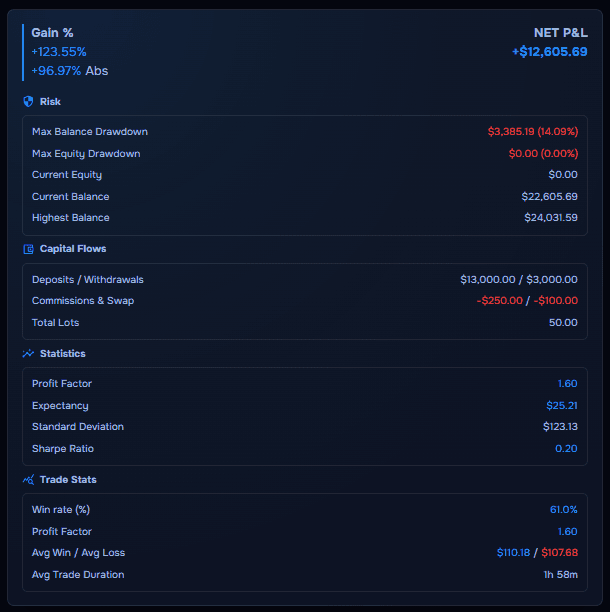
Individual losing trades only show part of the picture. Drawdown is the decline in account equity from a previous peak to a subsequent low, normally expressed as an amount or percentage. It reveals the depth and path of a decline at account level.
Drawdown does not identify the cause by itself. Trade-level analysis is still needed to determine whether the decline came from a normal sequence of strategy losses, oversizing, correlated exposure or broken rules. As Why Your Win Rate Can Lie shows, headline results can hide the real story until you review the risk behind them.
Example
Consider two traders who both finish a month up 4%. Trader A’s equity curve is relatively stable, with a modest drawdown along the way. Trader B also finishes up 4%, but only after a sharp mid-month drop. Profit alone makes them look similar. Drawdown shows that Trader B’s path involved far more account-level damage. Looking at the trades during that drop is what reveals whether the cause was oversizing, concentrated exposure, broken rules or a normal losing sequence.
Profit alone also leaves out how much variability was taken to achieve the return. The Sharpe ratio compares excess return above a benchmark or risk-free rate with the standard deviation, or variability, of returns. A higher Sharpe ratio generally means more excess return per unit of measured volatility. It should not be viewed in isolation, and it does not measure position sizing, concentration, execution quality or maximum loss. It can also be unreliable when calculated from a small sample, when returns are highly uneven, or when results use different periods or methods. It is not suitable for judging performance from only 20 to 40 trades. Used carefully, it can still help when comparing longer samples alongside drawdown and other trading performance metrics.
When reviewing a drawdown period, open the trades that occurred from the peak to the low and ask what was happening: a normal losing sequence, one unusually large loss, increasing size, repeated losses from the same setup, or several related positions losing together. Write one sentence on the most likely driver, then use that sentence to decide what to inspect next.
Key takeaway: Drawdown shows the depth of an equity decline, while risk-adjusted metrics such as the Sharpe ratio add context around excess return and variability. Neither replaces trade-level analysis of the cause.
Check for Concentration Risk
Several trades can look separate while creating very similar exposure. Concentration risk appears when positions depend on the same currency, sector, asset class, session or broader market movement. If those positions are correlated, losses can occur at the same time.
Looking only at risk per trade can understate total account exposure. Three trades at 1% planned risk each may look controlled until you realise they are effectively one idea. The useful distinction is between three separate trades and three positions relying on a similar underlying move.
Example
Imagine a trader is long EUR/USD, long GBP/USD and short USD/CHF at the same time. These look like three separate trades, but they all involve similar exposure to a weaker US dollar. If the dollar strengthens sharply, all three positions could move against the trader together. The issue is not the number of trades, but the combined exposure behind them.
Concentration can also appear without several positions being open at once. A large share of losses may come from one instrument, one session or one part of the trading day. That does not automatically mean the market or session should be removed. Check whether size was larger, volatility was higher, one setup was overused, or execution quality changed during that period.
Group recent trades by instrument and session, then mark any day where two or more open positions depended on the same currency or market idea. If those days also contain your largest losses, combined exposure may deserve more attention than the setup itself.
Key takeaway: Several positions can create concentration risk when they depend on similar instruments or market movements.
Run a Pre-Trade Risk Check
Historical review is only half the job. Once you know which risk problems appear in your data, the same questions should shape the decision before you click buy or sell.
A short pre-trade check can catch many expensive mistakes while the trade is still optional. Before entry, estimate the loss at the intended stop, then ask how fees, spreads, slippage or market gaps could increase that figure. Check total planned risk already open across the account. Ask whether the new position duplicates an existing currency, sector, asset-class or market view. Confirm that combined exposure would not breach your predetermined daily, weekly or portfolio risk limit. Finally, ask whether size is being influenced by the previous trade’s outcome or an urge to recover losses.
Those limits need to be decided in advance from your own strategy, capital, market and risk tolerance. There is no universal daily or portfolio limit that fits every trader.
If your review showed post-loss size increases, the pre-trade check should force planned risk to stay unchanged after a losing trade. If correlated USD positions caused clustered losses, the check should block a new trade that would recreate the same combined exposure.
Key takeaway: Spotting risk problems in your history is useful only if those findings become a pre-trade check that prevents the same exposure from opening again.
Separate Strategy Problems From Execution Problems
Not every losing trade means the strategy is wrong. A valid strategy loss is a trade that followed the plan and still lost. An execution problem is a trade that changed the process: late entry, oversized risk, a moved stop, or a setup that never met the original criteria.
Clean executions should be the primary sample for evaluating the intended setup. Rule-breaking trades should be reviewed separately. Judging both together can make a workable setup look broken, or hide a process problem that needs a clearer rule rather than a new strategy.
Example
Suppose a trader reviews 40 trades and notices that five of the largest losses came from reversal trades. That might suggest the reversal setup is weak. On closer review, six of the eight reversal trades were entered before the confirmation rule had been met. Only a small clean sample remains. The immediate problem is execution, not necessarily the strategy.
Frequent execution mistakes may also mean the strategy’s rules are ambiguous, overly complicated or difficult to apply consistently. Real-world usability matters alongside theoretical performance. Commissions, spreads, slippage and other normal trading costs should remain part of the clean performance sample, because they are part of trading the setup as intended.
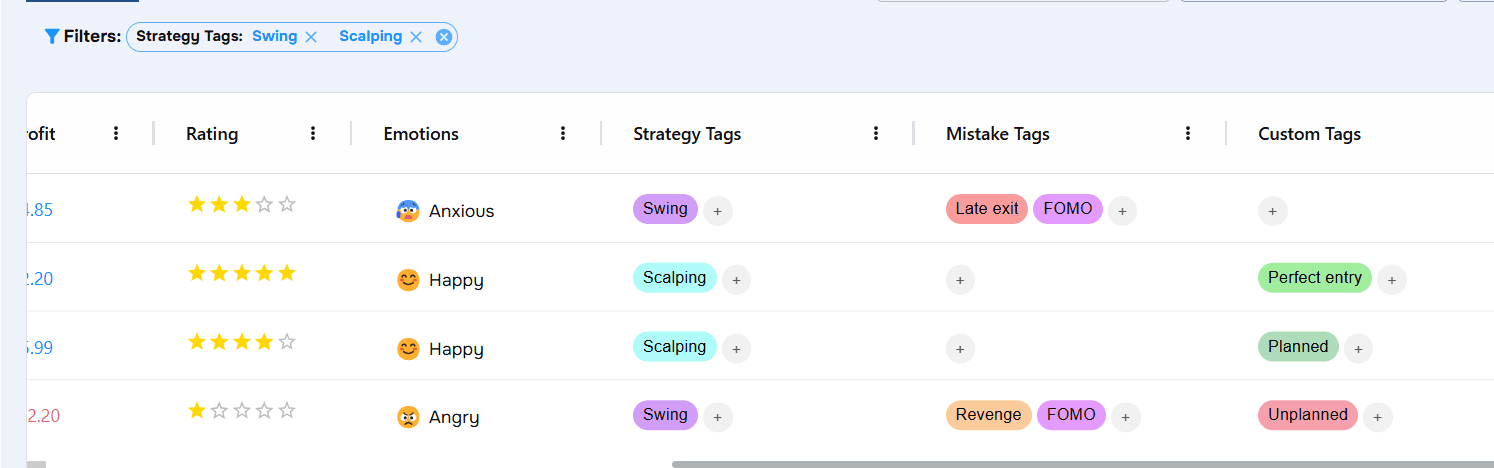
Sample size still matters. Three losses on a setup, one bad week or two weak trades on one instrument can look significant without proving much. Record both the setup and whether the trade followed the plan. A trade journal with setup and mistake tags makes that separation easier to review over time.
Key takeaway: Use clean executions as the main sample for judging a setup, review rule-breaking trades separately, and ask whether frequent mistakes mean the rules themselves are hard to follow.
Make One Risk-Management Change and Test It
Once you identify a specific problem, avoid changing the entire strategy. Match one change to the evidence, then review whether that source of risk becomes less significant. Changing entries, exits, size, markets and sessions at the same time makes it impossible to know what helped.
Examples
Problem: Position size increases after losses.
Evidence: Planned risk is usually £40, but several post-loss trades were taken at £65 to £80.
Change: Keep planned risk unchanged after a losing trade.
Review: Check the next set of trades after losses and see whether size stayed consistent.
Problem: Several correlated trades create excessive combined exposure.
Evidence: The largest losing days included multiple USD-related positions moving together.
Change: Set a predetermined limit for total exposure across related positions.
Review: Track whether clustered losses from the same underlying idea become less frequent.
Problem: A setup looks weak, but many trades broke the rules.
Evidence: Most reversal losses were entered before confirmation.
Change: Reinforce the confirmation rule and review a cleaner sample before changing the setup.
Review: Compare the next clean executions with the mixed sample you started with.
Short-term P&L alone is a weak judge of the change. A better week may be luck. A worse week may still include better risk behaviour. Ask whether the identified source of risk became less significant, whether another habit replaced it, and whether you actually followed the rule on later trades.
Key takeaway: Risk-management changes should respond to something you can identify and measure in your trading history, then be checked before future entries.
Conclusion
Before changing the strategy, identify which measurable component of risk is actually creating the problem: position size, drawdown, concentration or execution.
Then follow a short sequence. Set one matching rule. Use that rule in a pre-trade check before the next entry. Review the next sample of trades to see whether the original source of risk became less significant.
TraderWaves helps you review those components in one place with analytics and a trade journal, so you can see where risk is building and whether the change actually helped.
What should I review besides P&L when managing trading risk?
Why is position size so important for trading risk?
What is concentration risk in trading?
What should I check before entering a trade?
How do I separate strategy losses from execution problems?
What should I change after finding a risk problem?
Ready to journal?
Start Tracking Your Trades Today
Sign up now and access advanced trade journaling tools for free.
Start Free: No Credit Card