Analytics Dashboard Features
Trade with Data
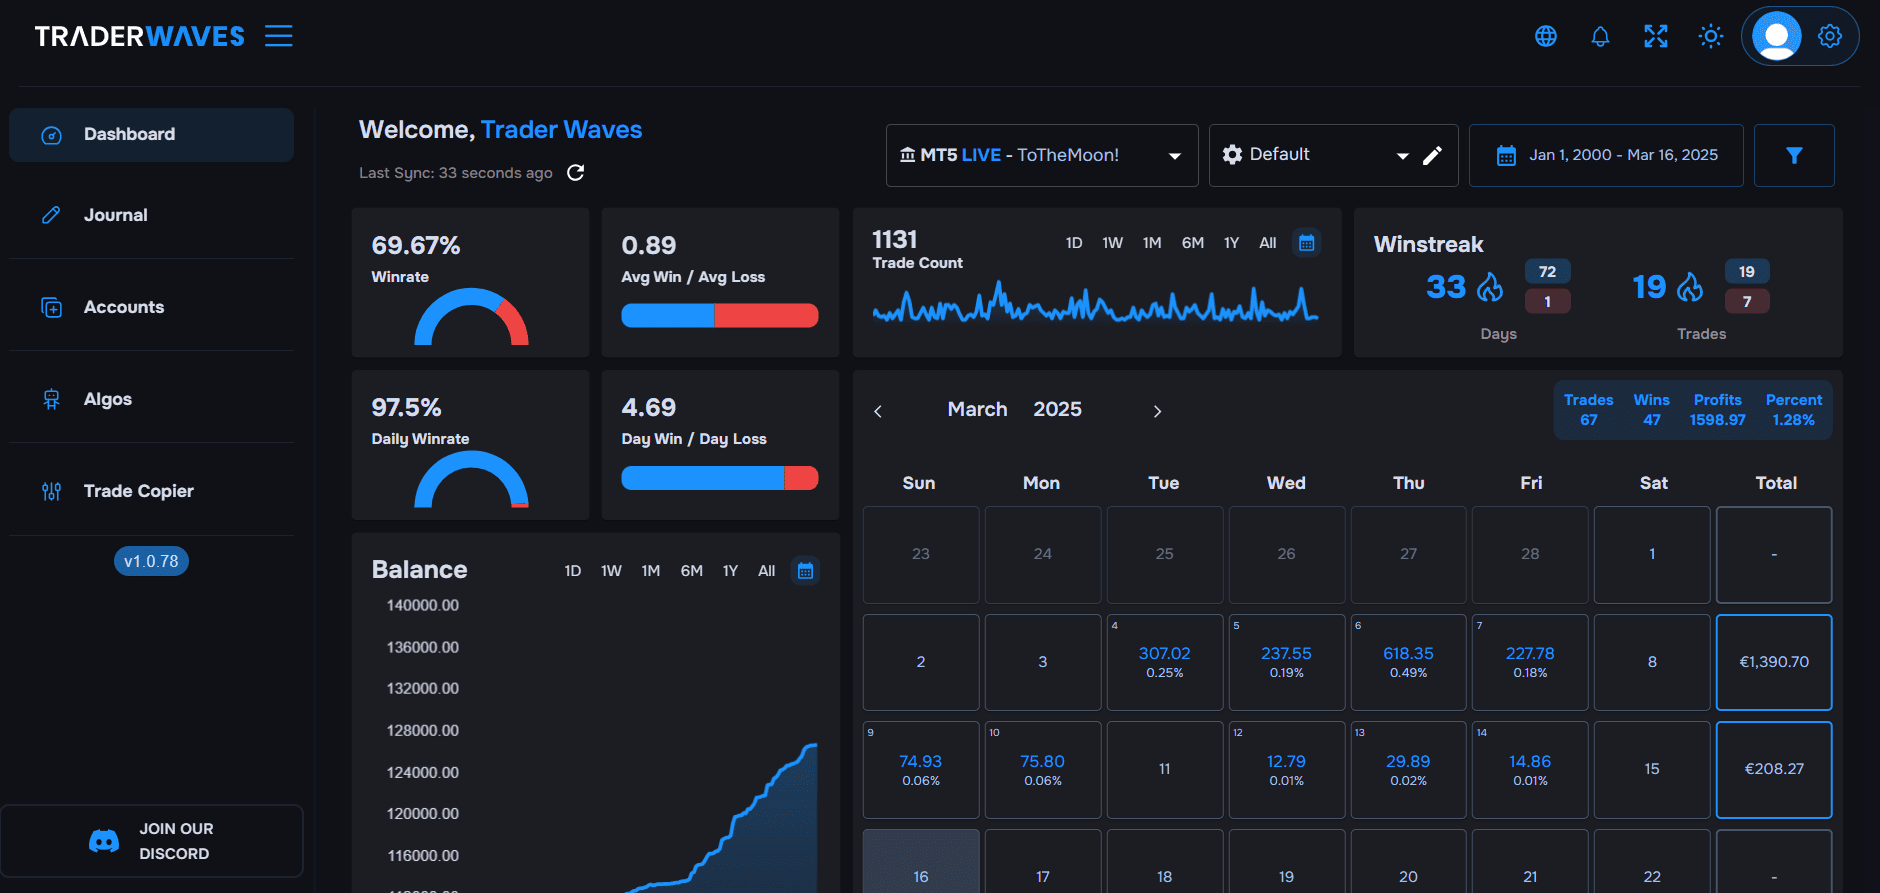
An all-in-one trade analytics tool designed to elevate your trading. Customize your dashboard with drag-and-drop widgets. Use real-time trade analytics software and advanced filtering to refine your strategy and trade with confidence.
What’s Holding Your Trading Back?
You're making trades, but your balance isn't increasing. Are you tracking what's actually working? With trade tracking, you'll be able to uncover the gaps in your strategy.
Some trades win, some don’t. Are you using the right setups for the right market conditions? The right trading analytics can help you optimize your approach and avoid costly mistakes.
Some days are great, others... not so much. Do you actually know what days, sessions, or conditions bring out your best trades?
Trading across platforms makes manual tracking a headache. It’s easy to miss data, make mistakes, or stop journaling altogether.
Why Trade Analytics Matters
Raw P&L doesn't tell the full story. Detailed trade performance analytics let you break down performance by strategy, asset, time of day, and more.
Break Down Your Performance
Looking at overall P&L isn’t enough. Detailed trade analytics let you break down performance by strategy, asset, time of day, and more.
Track What Actually Works
Do you win because of skill or luck? Stats like risk-reward, average hold time, and execution quality reveal your true trading edge.
Stop Making the Same Mistakes
Identify patterns in your losing trades. Spot bad habits, overtrading, and poor risk management before they cost you more money.
Improve Like a Pro
Elite traders review their stats to refine their strategy. Use data-driven insights to make smarter decisions and grow faster.
Why TraderWaves? Here's the Full Picture
If you're serious about becoming a better trader, it starts with clarity. This quick walkthrough breaks down why trade tracking matters, where other tools fall short, and how TraderWaves is built to help you actually improve.
Serious About Improving?
Without analytics, you're trading in the dark. Understanding win rates, risk-reward ratios, and setup performance helps you identify what’s actually driving results.
.png)
Why Not Just Use Excel or Notion?
Spreadsheets and trade journal templates aren't built for performance insights. They lack automation, visual feedback, and filtering, making it hard to spot profitable patterns or track strategy-level outcomes over time. Trade analytics software gives you all this and more, without the hassle.
.png)
What About Other Journals?
Many platforms offer trade logging, but reserve advanced analytics for paid users. With TraderWaves, powerful insights like win rates, trade tagging, and performance filters come standard — no subscriptions, no limitations.
.png)
Why TraderWaves Works.
TraderWaves gives you deep trade performance analytics, from strategy filtering to trade tagging and win rate trends. All automated, all in one place, and free to use.
Empowering Traders with Insights That Matter
Discover how our powerful analytics dashboard helps you track your performance, uncover patterns, and optimize your trading strategies.
Advanced Filtering
Focus on the trades that matter most by filtering by date, strategy, or custom tags to uncover patterns that refine your trading edge.
Real-Time Stats
Get live insights into your trading performance. Adapt your strategy as markets move and make data-driven decisions with confidence.
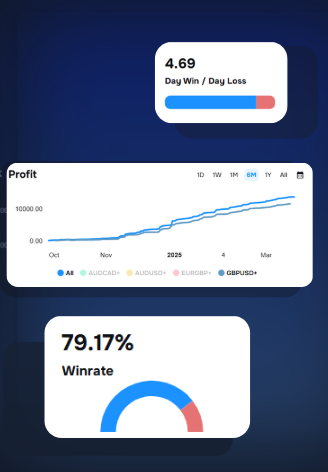
Profitability Charts
Visualize your profits, losses, and success rates with detailed charts that help you understand what’s working, what isn’t, and how to improve.
Your Trading Problems, Solved
We built TraderWaves to tackle the issues traders face every day so you can focus on improving, not just surviving.
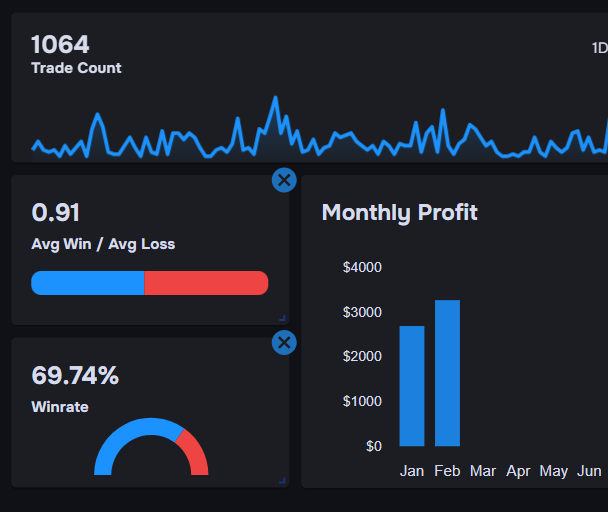
Custom Metrics, Real Progress
If your account isn’t growing, you might be tracking the wrong things. With personalised dashboards, you can focus in on the exact metrics that reveal what’s working (and what’s not).
- Unlimited templates — Create dashboards tailored to different strategies, styles, or market conditions.
- Personalised widgets — Track only the metrics that align with your goals—like risk, R:R, or trade duration.
- Drag, drop, resize — Shape your workspace around what drives results, not distractions.
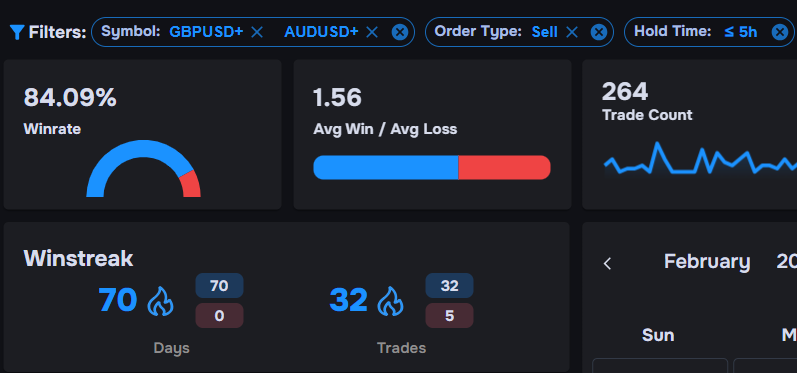
Filter Your Way to Winning Setups
Log every trade with a single click and get detailed reports on your strategy performance over time.
- Powerful trade filters — Break down trades by strategy, date, hold time, and custom tags to spot patterns.
- Live performance metrics — Track win rate, profit factor, and P&L trends to measure setup consistency.
- TradingView integration — See how news and macro events align with your best (and worst) trades.
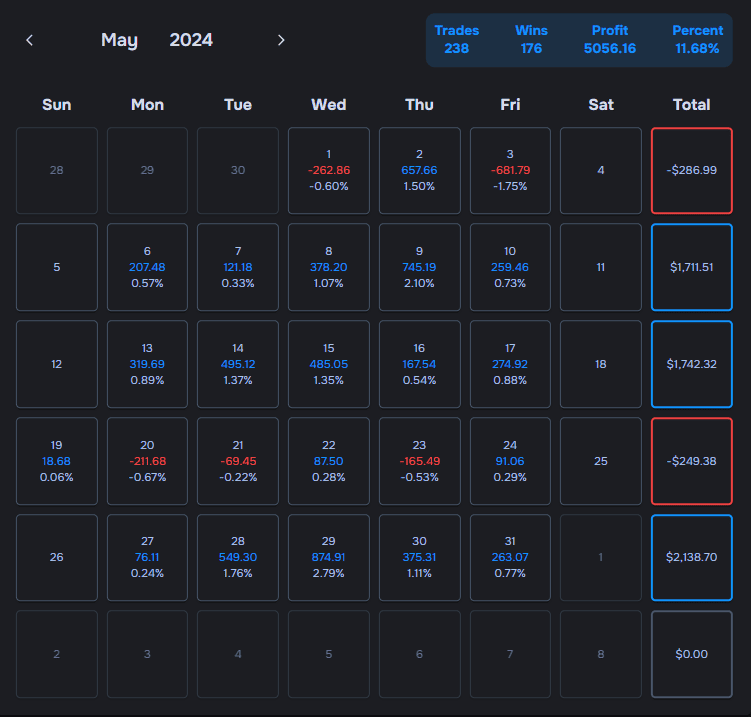
Turn Daily Data Into Discipline
Build more consistent habits by reflecting on your trading days. The Profit Calendar helps you monitor performance, spot patterns, and reflect on sessions.
- Visual profit calendar — Spot your strongest days, toughest sessions, and long-term trends at a glance.
- Daily trade breakdowns — Explore P&L, session details, and trade entries to discover which days set you up for success.
- Effortless journaling — Quickly tag trades and log your mindset without interrupting your trading rhythm.
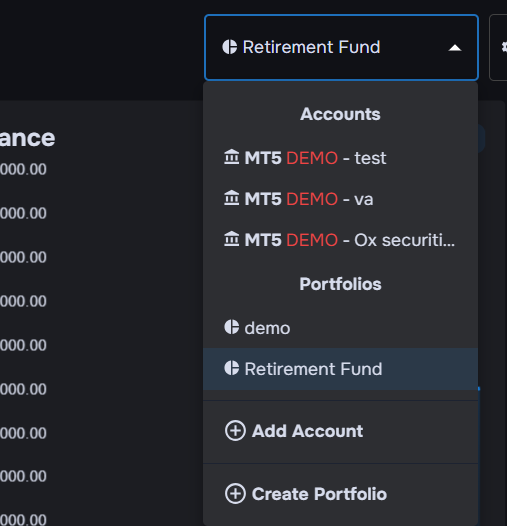
From Scattered to Synced in Seconds
Track every trade with a single click and get detailed reports on your strategy performance over time.
- Portfolio-wide tracking — Monitor multiple accounts and different platforms within one unified view.
- Automated trade syncing — No spreadsheets, no manual data entry. All your trades are imported in seconds
- Full broker compatibility — Supports all MT5 and DxTrade brokers, with more platform integrations on the way.
Analysing Today, Winning Tomorrow
Dive deeper into your trades and track your performance like a pro with the help of trader analytics.