5 Day Trading Performance Metrics You Should Actually Track
TraderWaves Team • 4 May 2025 • 4 min read
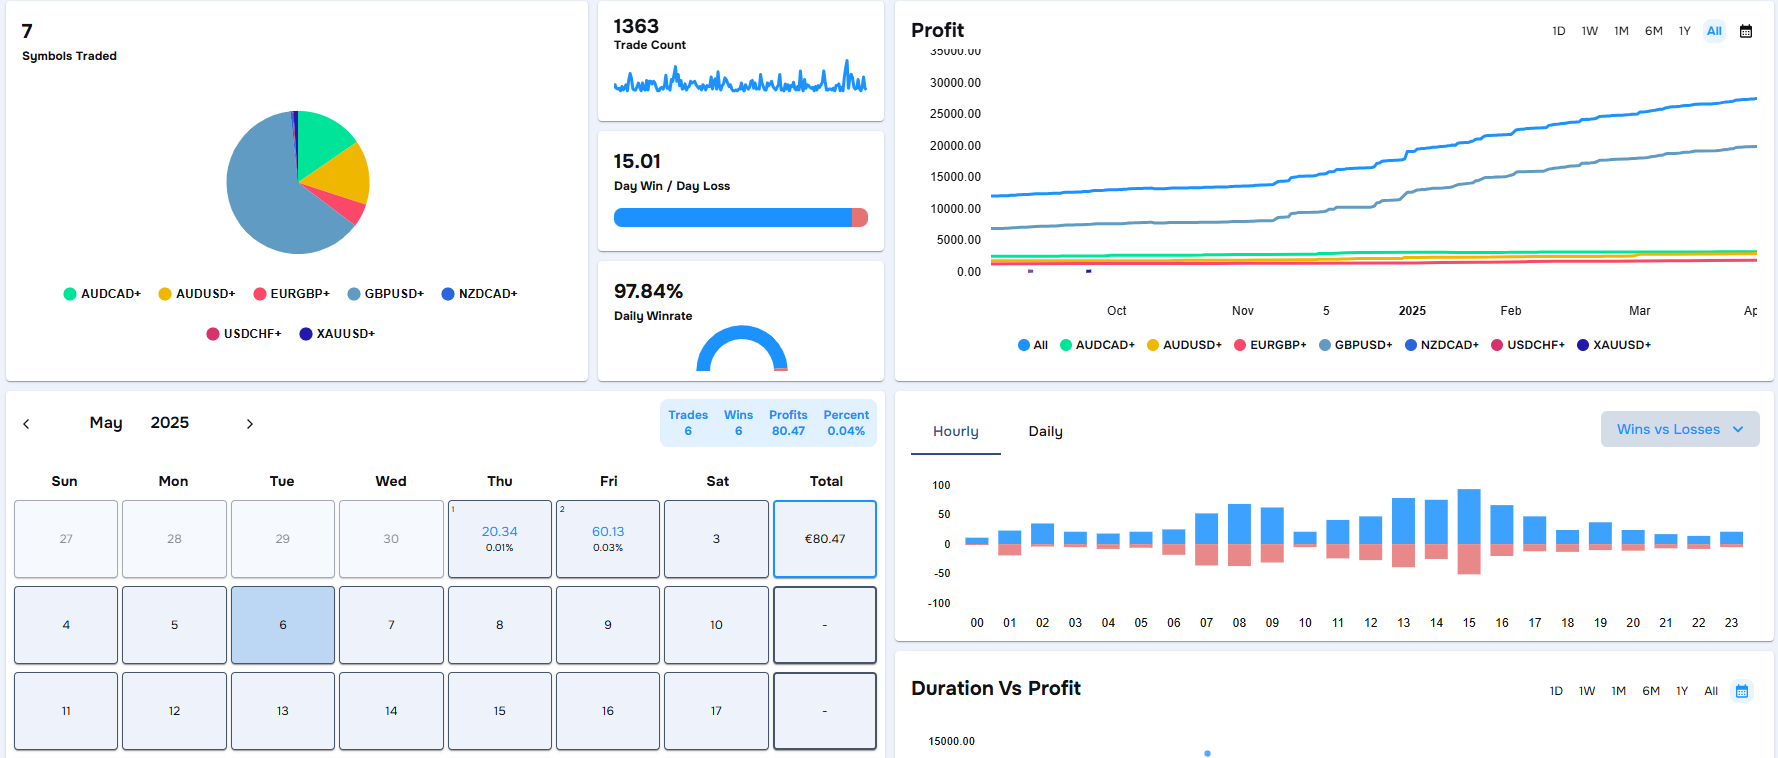
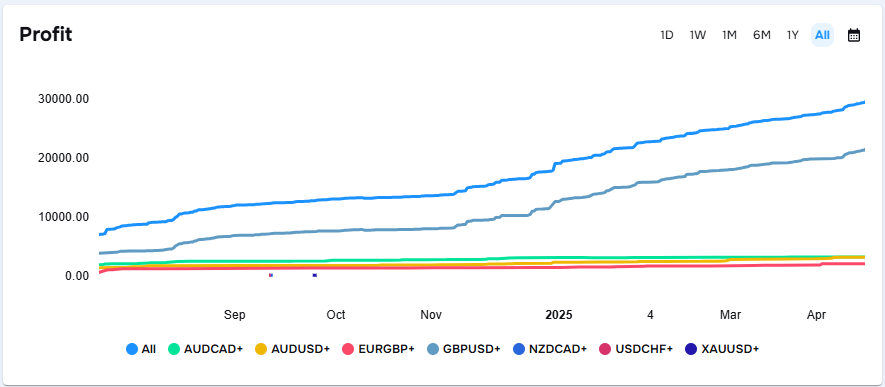
1. Profit
Profit is the obvious one, but that’s because every trader knows how important it is. Knowing if you are in the green is valuable especially if you don’t want to blow your account. There are different ways to display your profit metric. Using a Profit Chart helps track consistency in your profit and this can be used for daily checks or even weekly and monthly progress. The daily profit view is useful for spotting if one bad trade wiped out your progress or if a strong move carried your day. While weekly and monthly views are valuable for zooming out. In doing so, you can see if your current setup is working or if it is time to revise your trade plan. You can also toggle individual symbols to see which ones are actually making you money so you can continue to trade winners. It’s one of the most used tools for a reason.
Another way to view profit is through the P&L Calendar. It provides an overview of your trading results each day of the month, with weekly, and monthly profit totals. The daily view makes it easy to check if you’re staying consistent or slipping into overtrading, while the monthly view gives a more comprehensive picture of your performance and patterns. Whether you’re in the green or red, it's immediately clear which days are in need of further analysis.
Key Insight: A top day trading performance metric, profit shows if you're truly in the green. Use symbol filters level up your trade tracking.
2. Trade Duration vs Profit
Trade duration vs profit reveals the relationship between how long you hold your trades and the profitability of the trade. It’s a simple but effective way to assess whether time in market is helping or hurting your strategy. It is often an underused tool but is invaluable. This chart highlights common habits like holding onto losers for too long or cutting winners too soon. Paired with a trade journal, it becomes a crucial tool for identifying execution flaws and refining how long you should be in a trade.
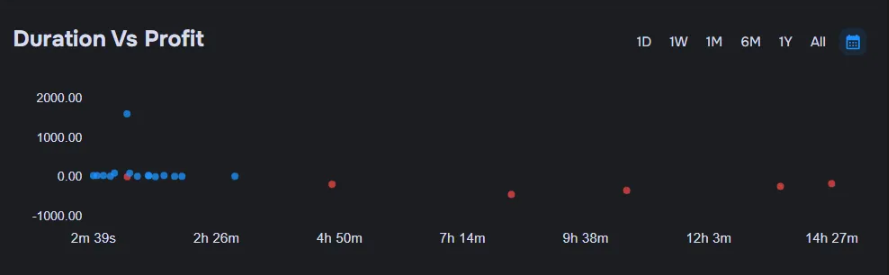
In the example above the data shows a clear pattern: trades held longer throughout the day were consistently less profitable. That might suggest hesitation, missed exits, or simply a loss of focus — all things that can happen when you step away from the screen or lose touch with your setup. You can check your journal for any tags that back this up.
Key Insight: Discover if you’re holding losers too long or exiting winners early. This metric pairs well with our free trading journal to sharpen entries and boost day trader performance.
3. Win Rate
Win rate seems simple but it can be broken down into further metrics. Whether it’s your overall win rate or your daily win rate, each reveal different insight. Overall win rate is great for measuring long-term consistency and setup efficiency. While daily win rate reveals how consistently you win a trade. However, a high win rate doesn’t guarantee profitability and a low win rate doesn’t automatically mean failure. What matters is how often you win vs how much you win. For example, a 40% win rate can still lead to strong results if your average win is 2–3x bigger than your losses. This is why win rate and average win/loss is the only sensible trade tracking combo.
Key Insight: A strong average win rate day trading only matters if paired with a solid risk-reward. This duo is one of the top trading metrics to track for real growth.
4. Trade Count
The Trade Count metric tracks how many positions you’ve opened within a specific timeframe i.e. daily, weekly, or monthly. For day traders, it’s a practical measure of trading intensity and discipline. Monitoring this number alongside other performance metrics helps identify whether high activity is leading to meaningful results or just overtrading. When paired with profit or win rate charts, Trade Count offers valuable insights on the efficiency of your trading activity.
Key Insight: Tracks how often you trade to avoid forming overtrading habits and check if high activity equals high performance.
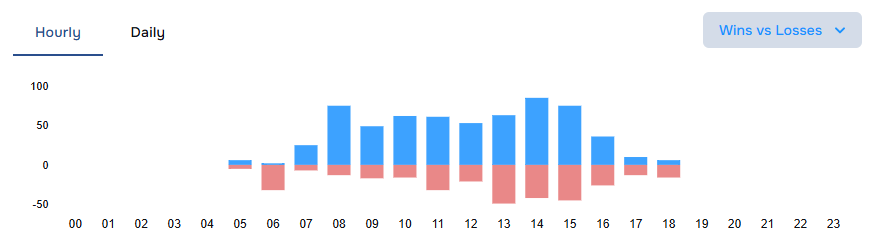
5. Trade Distribution (The 4-in-1 Power Stat)
We saved the best tool until last. This widget brings four key performance views into one: Wins vs Losses, Buys vs Sells, Direction Profit, and Total Profit — all filterable by hour or day. For day traders, the Total Profit by Hour and Wins vs Losses metrics with the hourly breakdown stand out. The hourly display allows you to pinpoint your most profitable trading windows. For traders looking to optimise timing and session planning, it’s one of the fastest ways to identify the best time of day to trade.
Key Insight: Trade distribution’s hourly breakdown shows the best time of day to trade. Pair with Profit and Direction stats for further trade performance analytics.
Honourable Mention: Symbols Traded
This metric is key if you’re trading multiple symbols, providing you with a quick view of where most of your trades are going. It is not bad to have unbalanced trades per symbol but it can help you figure out which one is most profitable. When used with the Profit Chart and Trade Distribution, it helps you spot which symbols are helping (or hurting) your profits so you can stick with what’s working.
Conclusion
Tracking your trades daily doesn’t have to be overwhelming. By focusing on core day trading performance metrics like profit, trade duration, win rate, trade count, and trade distribution, you can spot patterns faster and make better trading decisions.
All of these widgets are built into the TraderWaves analytics dashboard, perfectly arranged in our day trading template. Click the signup link to get started — and let your data work for you.