How a P&L Calendar Can Elevate Your Strategy
TraderWaves Team • 10 April 2025 • 5 min read
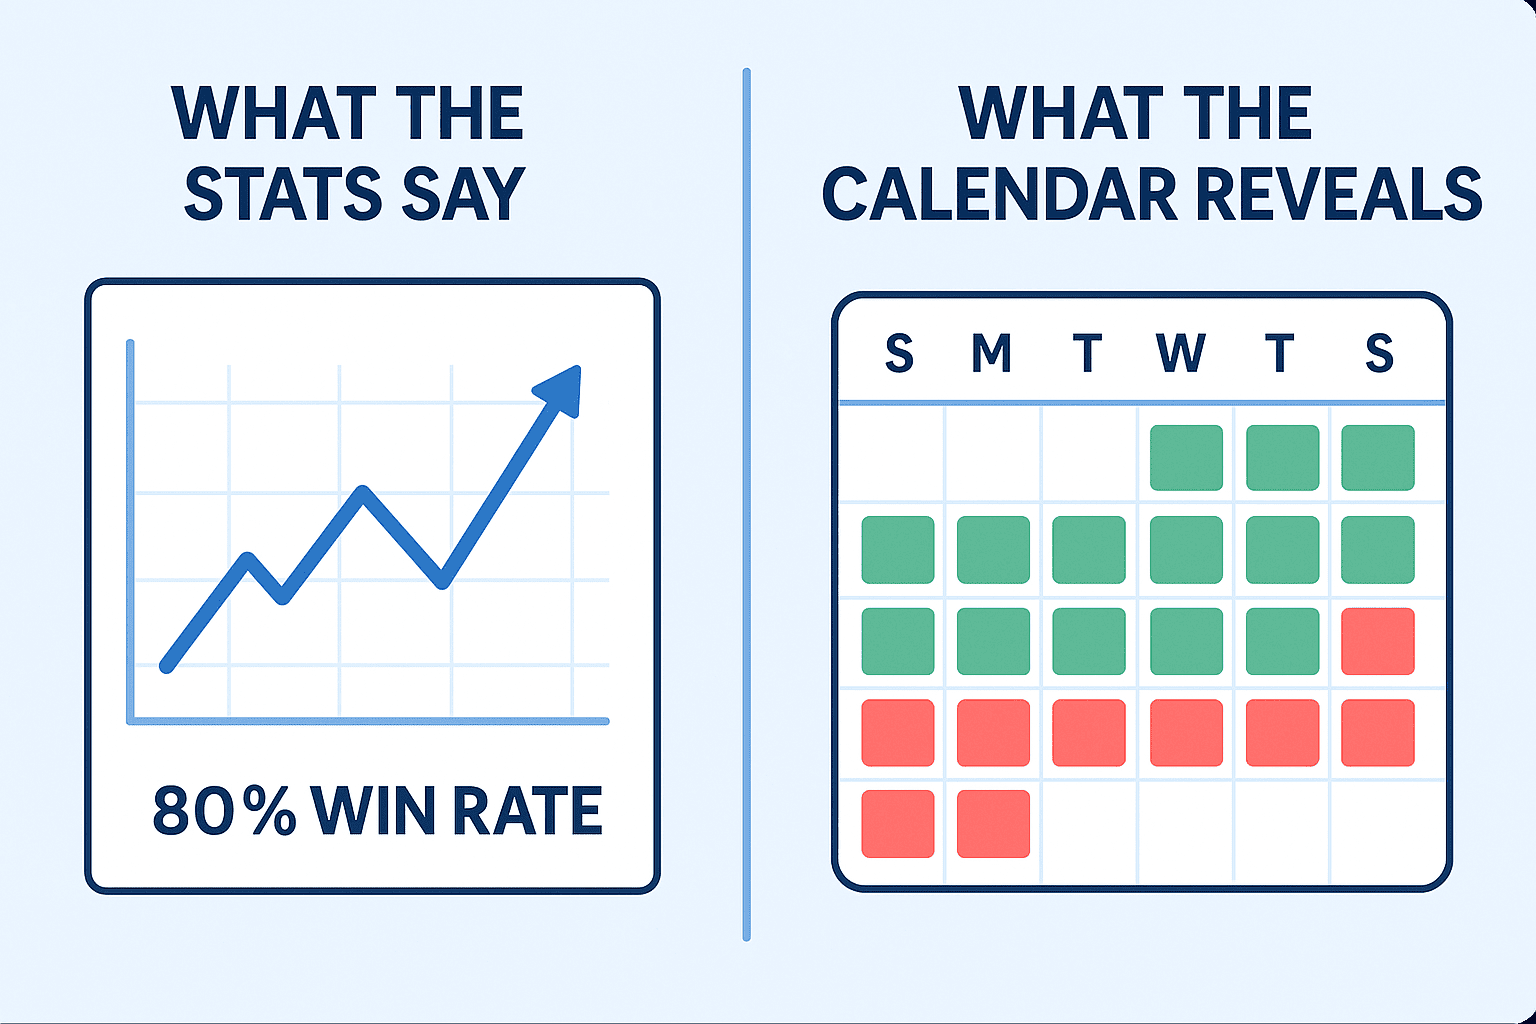
1. Bridging the Gap Between Data and Context
Your data is your biggest asset for improving your future trade outcomes. From your own trade logs you can gain direct insights into what works for you and what doesn't. Using trade analytics tools helps turn your raw data into something visual, trackable, and easier to learn from. Making sense of the raw data is progress but, to grow further it is essential that you spot the patterns in your trades. That's why tools like trade journals and P&L Calendars are part of every pro traders toolkit. They bridge the gap between what your stats say and why those results happened.
.png)
Take this example: you've just had a strong month. Your balance curve is trending upward, your profit graph is soaring, and your P&L looks great. Naturally, you want to keep that momentum going. To do that, you need to play detective with your data and figure out what is causing this positive shift and how you can repeat it next month. Trade journals provide context through your written notes on a given trade, highlighting any psychological factors at play or new setups you've been testing. A PnL calendar has a slightly different approach...
Key takeaway: Raw trade stats show you the outcome but tools like P&L calendars and trade journals help you uncover the why. These tools provide the insight you need to grow, adapt, and stay consistent.
2. What Makes a P&L Calendar Different From Other Tools?
The power of the Profit and Loss calendar as an effective analysis tool is often overlooked. Many traders, especially beginners, tend to focus solely on performance metrics like win rate, profit graphs, and trade count. While these metrics are valuable for measuring trade outcomes and overall profitability, they don't offer any context behind those results. For example, let's say you've had a strong win rate and an increased trade count. At first, you might conclude it was a great month more trades, more wins, more profit.
However, when you review your P&L calendar, a different conclusion starts to emerge. Most of your profits came from just one standout week. The rest of the time, your results were inconsistent, especially on the days where your trade count was highest. By looking at the overall performance for the month we can see that those initial headline metrics didn't tell the full story! Without the calendar view, your takeaway might have been completely different. The P&L calendar doesn't replace your other stats, it completes the picture. Having a full overview of your performance is key to understanding what's actually working and where there's room to improve.
Key takeaway: Headline stats can miss the full picture. A P&L calendar provides a complete overview allowing you zoom out and spot real patterns across days, weeks, and the whole month.
3. What Makes Visual Trade Tracking So Powerful
– Instant pattern recognition: Identify hot streaks, slumps, and trading rhythm shifts at a glance.
– Consistency made visible: Quickly know if you are sticking to your strategy.
– Visual accountability: Disciplined days are clearly displayed, allowing you to stay accountable.
– Routine-building roadmap: Identify your habits over time and refine your daily trading flow.
When you can see your trades instead of just reading them, your review process becomes quicker and more intuitive. With colour-coded daily summaries, the P&L calendar highlights your best and worst days instantly, no need to sift through rows of data to find the patterns. It also makes it easier to stay accountable. You can immediately see how consistently you've followed your goals. If you've fallen off track, a quick check in your journal can reveal what might've been at play whether it was mood, market conditions, or a break in routine.
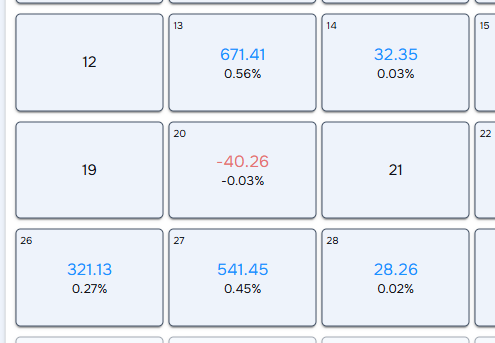
Fig.1. Colour-coded P&L days in the calendar
Consistency is key to long-term success, and the calendar helps you measure it effortlessly. At a glance, you'll know how many days you traded, how often you followed your trade plan, and whether your strategy is sticking. Testing a new setup? The PnL calendar makes it clear how it's performing over time, so you can decide whether to double down or adjust. Over time, your calendar becomes a roadmap uncovering when streaks, slumps, and behavioural shifts occur. You'll start spotting recurring patterns, like Friday wins or Monday slumps, and use that insight to self-correct. As your consistency grows, so does your confidence and that's what leads to real progress.
Key takeaway: Colour-coded summaries highlight trading performance across different time periods helping you spot patterns, track consistency, and review with clarity.
4. See the Calendar in Action
In the TraderWaves P&L calendar, each day is color-coded by profit or loss, so your strongest (or toughest) sessions stand out instantly. Consistency is effortless if the process is made easy. Need to investigate a red day or review how a new strategy is playing out? Unpack exactly what happened, simply select on a trade day for a more in-depth daily summary. Want to investigate further? Click view more to access the trade journal from the calendar, where you can review your tags, notes, and pinpoint what went wrong. Was it an emotional entry? A rushed setup? Maybe "FOMO," "overtrading," or a "breakout retest" that didn't work?
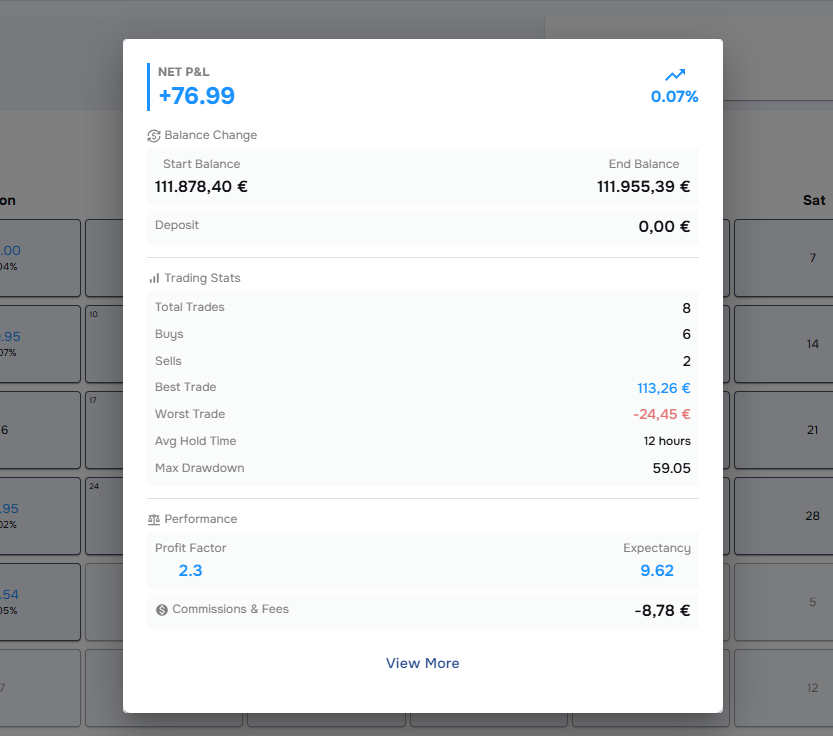
Fig.2. Daily summary with statistics preview within the calendar
Beyond daily tracking, the calendar highlights weekly and monthly totals, helping you assess your progress over different time periods. This makes it easy to spot profitable streaks, shaky periods, or changing behavior patterns.
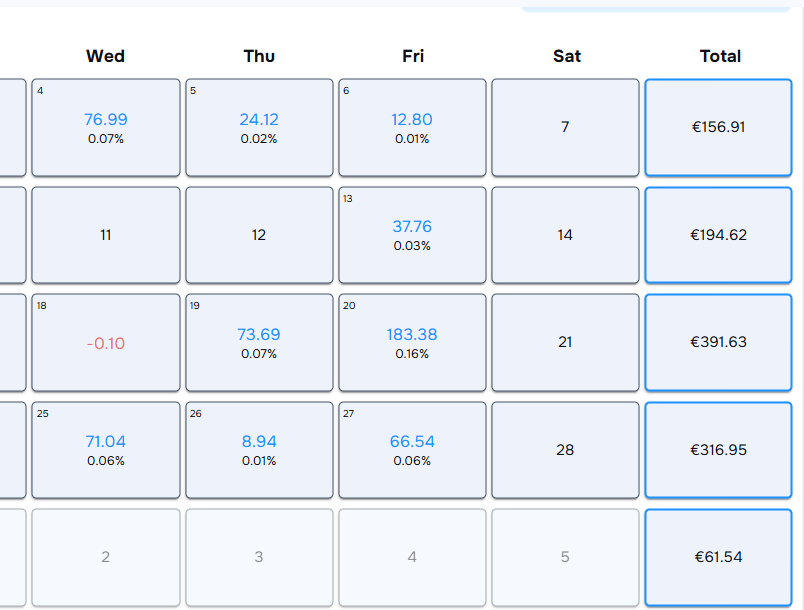
Fig.3. Weekly and Monthly Profit totals
In our free trading journal calendar, you can also track deposits and withdrawals directly on the calendar, offering a clear link between capital shifts and psychological performance changes. Together, these features turn your trade log from raw data into actionable insights.
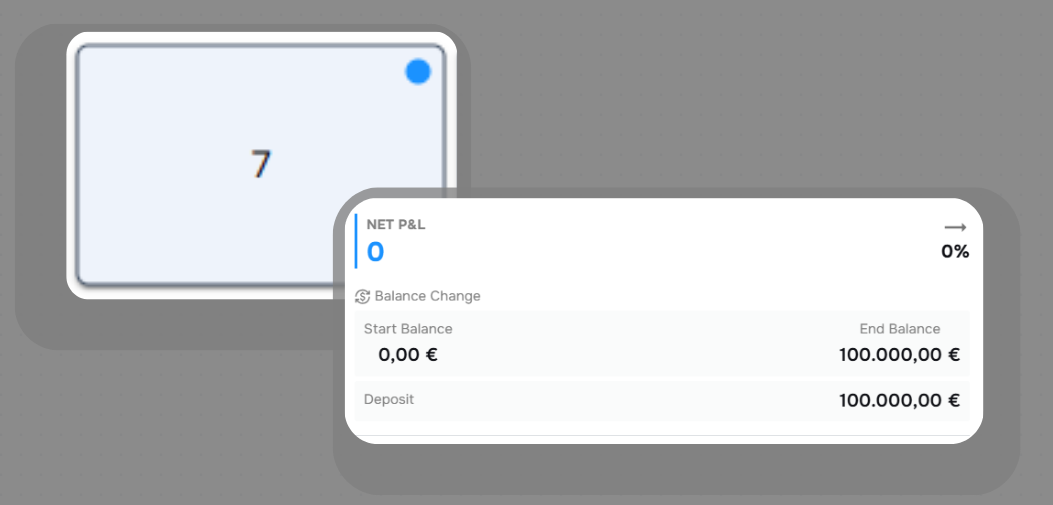
Fig.4. Deposit displayed in the calendar and Daily Summary
Key takeaway: The PnL calendar doesn't just show what happened, it helps you understand why it worked (or didn't), so you can elevate and refine your strategy with confidence.
Conclusion
Building a stronger strategy isn't about throwing out your current system, it's about creating a more complete picture of your performance. Bad trading habits can stall your progress, but catching them early is key. Setting aside just 10 minutes each week to review your execution can help you spot mistakes before they repeat, reinforce what's working, and build long-term momentum. Our free P&L calendar adds the context most traders miss, helping you connect the dots between outcomes, behavior, and strategy
Key takeaway: The P&L calendar is a powerful tool in your toolkit. Start using your free P&L calendar today